ZenJMX is a ZenPack that allows Zenoss to communicate with remote JMX agents. The ZenJMX ZenPack introduces a data source of type 'JMX'. A 'JMX' data source allows you to define which JMX attributes should be monitored by Zenoss, as well as which operations you wish Zenoss to invoke. The ZenPack also introduces the zenjmx daemon, which is used to perform the actual retrieval of data from a JMX agent.
Java Management Extensions (JMX) are used throughout the Java Virtual Machine to provide performance and management information to clients. Using a combination of JConsole (Sunâs JMX client that is shipped with the JDK) and JMX, a system operator can examine the number of threads that are active in the JVM or change the log level. There are numerous other performance metrics that can be gleaned from the JVM, as well as several management interfaces that can be invoked that change the behavior of the JVM.
In Java 5 Sun introduced the âRemote API for Java Management Extensions. This enhancement defines an RMI wrapper around a JMX agent and allows for independent client development. ZenJMX accesses remote JMX agents via the "Remote API for Java Management Extensions". It currently does not support local connections (provided via the temporary directory) to JMX Agents.
ZenJMX is a full-featured JMX client that works out-of-the-box with JMX agents that have their remote APIs enabled. It supports authenticated and unauthenticated connections, and it can retrieve single-value attributes, multi-value attributes, and the results of invoking an operation. Operations with parameters are also supported so long as the parameters are primitive types (Strings, booleans, numbers). Multi-value responses from operations (Maps and Lists) are supported, as are primitive responses from operations.
The "JMX" Data Source installed by ZenJMX allows you to define the connection, authentication, and retrieval information you wish to use in order to retrieve performance information. The IP address is extracted from the parent device, but the port number of the JMX Agent is configurable in each data source. This allows you to operate multiple JMX Agents on a single device and retrieve performance information for each agent separately. This is commonly used on production servers that run multiple applications.
Authentication information is also associated with each JMX Data Source. This offers the most flexibility for site administrators because they can run some JMX agents in an open unauthenticated fashion and some JMX agents in a hardened and authenticated fashion. SSL wrapped connections are supported by the underlying JMX Remote subsystem built into the JDK but they were not tested in the Zenoss labs. As a result, your success with SSL encrypted access to JMX Agents may vary.
The Data Source allows you to define the type of performance information you wish to achieve: single-value attribute, multi-value attribute, or operation invocation. Each is described in detail in following sections. To specify the type of retrieval you'll need to either specify an attribute name (and multiple or a single data point) or you'll need to provide operation information.
Any numerical value returned by a JMX agent can be retrieved by Zenoss and graphed and checked against thresholds. Non-numerical values (Strings and complex types) cannot be retrieved and stored by Zenoss.
Tread carefully when selecting the data point type. Many JMX Agent implementations use inconsistent nomenclature when describing attributes. In some cases the term "Count" refers to an ever-increasing number (a "Counter" data point type). In other cases the term "Count" refers to a snapshot number (a "Gauge" data point type). Make sure you understand the semantics of the attribute name and choose the proper Zenoss data point type when you set up your data point.
This is the most basic usage scenario. If you are interested in retrieving a single value from an MBean in a JMX Agent you fall into the "single value attribute" category. To define a single-value attribute call simply provide the fully qualified name of your MBean and then provide the name of the attribute in the "Attribute Name" field of the data source. Lastly, you must define a data point that has the same name as the "Attribute Name" you previously defined.
Zenoss recognizes a single value attribute mode when you have only 1 data point and it's name matches the Attribute Name defined in the data source. Some examples of this include the commonly referenced JDK Threading information:
-
MBean Name: java.lang:type=Threading
-
Attribute Name: ThreadCount
-
Data Points:
-
ThreadCount (type: counter)
-
Java uses lots of file descriptors during normal operation. The number of open file descriptors the JVM is working with can be measured using the following information:
-
MBean Name: java.lang:type=OperatingSystem
-
Attribute Name: OpenFileDescriptorCount
-
Data Points:
-
OpenFileDescriptorCount (type: gauge)
-
There are several other single-value attributes that can be retrieved from the JDK. We recommend using JConsole to interactively navigate through the MBean hierarchy to determine which MBeans contain useful information to you. See the "Interrogating an JMX Agent via JConsole" section for additional information on how to inspect the MBeans deployed in an JMX Agent.
If your MBean attribute defines multiple subattributes that you are interested in capturing you fall into the category of a "multi-value attribute" call. The JDK contains a few multi-value attributes you might be interested in capturing, including garbage collection statistics that were captured during the copy and mark-sweep compact collection cycles.
The JDK also provides heap memory information via a multi-value attribute. The amount of committed, used, and maximum heap memory can be viewed by setting up a multi-value attribute in Zenoss with the following information:
-
MBean Name: java.lang:type=Memory
-
Attribute Name: HeapMemoryUsage
-
Data Points:
-
committed (type: gauge)
-
used (type: gauge)
-
max (type: gauge)
-
Some management values need to be computed. These situations frequently arise when custom MBeans are deployed alongside an enterprise application. An MBean named "Accounting" might be deployed within an enterprise application that defines operations intended for operators or support staff. These operations might include methods such as "getBankBalance()" or "countTotalDeposits()".
ZenJMX has the ability to invoke operations, but there are some subtleties in how ZenJMX sends parameters to the JMX Agent and interprets the response.
In the most basic usage scenario no arguments are passed to the operation and a single value is returned. This usage scenario is very similar to a single-value attribute call, except we're invoking an operation to retrieve the value rather than accessing an attribute. The configuration for this hypothetical usage scenario follows:
-
MBean Name: Application:Name=Accounting,Type=Accounting
-
Operation Name: getBankBalance()
-
Data Points:
-
balance (type: gauge)
-
In this scenario no parameters are passed to an operation, but multiple response values are provided in a List. The values returned are expressed in a List<Object>, but they are coerced (but not casted) to doubles prior to being stored in Zenoss. This means that returning a numeric value as "1234" will work, but "1,234" will not work. The litmus test is to evaluate if Double.valueOf(object.toString()) will successfully evaluate.
ZenJMX can be configured to read multiple values from an operation's results by defining multiple data points. You must define a data point for each value returned from the operation, and if there is a mismatch between the number of data points you define and the size of the List<Object> returned an exception will be generated. The configuration for ZenJMX follows:
-
MBean Name: Application:Name=Accounting,Type=Accounting
-
Operation Name: getBalanceSummary()
-
Data Points:
-
dailyBalance (type: gauge)
-
annualBalance (type: gauge)
-
In this scenario no parameters are passed to an operation, but multiple response values are provided in a Map<String, Object>. The keyset of the Map contains the names of data points that can be defined, and the values are the values of said data points. When a Map<String, Object> is returned you need not capture all of the returned values as data points, and you can instead pick the exact values you are interested in. To choose the values to capture you simply define data points with the same names as Strings in the keyset.
The following configuration demonstrates how to extract specific data points from an operation that returns a Map<String, Object>. The key item to note in this configuration is that "dailyBalance" and"annualBalance" must be present as keys in the returned Map<String, Object> and their values must be coercable via the Double.valueOf(object.toString()) idiom.
-
MBean Name: Application:Name=Accounting,Type=Accounting
-
Operation Name: getBalances()
-
Data Points:
-
dailyBalance (type: gauge)
-
annualBalance (type: gauge)
-
MBeans are implemented as Java classes and Java permits parameterized polymorphic behavior. This means that multiple methods can be defined with the same name so long as their parameter signatures differ. You can safely define "getBalance(String)" and "getBalance()" and the two exist as separate methods.
In order to properly resolve methods with the same name the caller must provide a Class[] that lists the types of parameters that exist in the method's signature. This resolves the candidate methods to an individual method which can then be invoked by passing an Object[].
ZenJMX allows you to resolve methods of the same name and asks you to provide the fully qualified class names of each parameter in comma delimited format when you set up the data source. Note that primitive types (String, Boolean, Integer, Float) are supported but complex types are not supported, and that you must include the class' package name when providing the information (java.lang.String).
The Object[] of parameter values must line up with Class[] of parameter types, and if there is a mismatch in the number of types and values that are provided an exception will be generated.
The marshaling of values from String to Boolean, Integer, and Float types is provided via the .valueOf() static method on each of those types. That is, if you define an attribute of type java.lang.Integer you must provide a String that can be successfully passed to java.lang.Integer.fromValue(). If you fail to do so an exception is generated.
This example illustrates how to pass a single parameter to a polymorphic operation:
-
MBean Name: Application:Name=Accounting,Type=Accounting
-
Operation Name: getBalances()
-
Parmaeter Types: java.lang.Integer
-
Parameter Values: 1234
-
Data Points:
-
balance (type: gauge)
-
Here's another example where we've changed the type of the parameter passed to the method to be a String. Semantically it represents a different type of Account in our example:
-
MBean Name: Application:Name=Accounting,Type=Accounting
-
Operation Name: getBalances()
-
Parmaeter Types: java.lang.String
-
Parameter Values: sbb552349999
-
Data Points:
-
balance (type: gauge)
-
The above example describes how polymorphic behavior in Java functions and how method resolution can be provided by identifying the Class[] that represents the parameters passed to a method. The situation where multiple parameters are passed to a polymorphic operation is no different then the situation where a single parameter is passed to a polymorphic operation, except that the length of the Class[] and Object[] is > 1.
When multiple parameters are required to invoke an operation you must provide the fully qualified class names of each parameter's type in comma delimited format, as well as the object values for each type (also in comma delimited format).
The following example demonstrates a configuration that passes 2 parameters to an MBean operation. The second parameter passed is a default value to return if no account can be located matching the first parameter.
-
MBean Name: Application:Name=Accounting,Type=Accounting
-
Operation Name: getBalances()
-
Parmaeter Types: java.lang.String, java.lang.Integer
-
Parameter Values: sbb552349999, 0
-
Data Points:
-
balance (type: gauge)
-
There are additional combinations that are possible with polymorphic methods and the values they return, and those combinations are left as an exercise for the reader to explore. The logic for extracting results from multi-value operation invocations follows the same rules as the logic for extracting results from a multi-value attribute read. For additional information on the rules of that logic see the section above on multi-value attributes.
The ZenJMX ZenPack defines a data source named "JMX" that allows you to query any single or multi-value attribute, or invoke an MBean operation. It also comes with a built-in template named "Java" that contains MBean information for a few beans built into the JVM.
When the "zenjmx" daemon is started it communicates with ZenHub using XML-RPC. It retrieves a list of devices that possess "JMX" data sources, and asynchronously issues queries to each of those devices. Processing of the responses is handled asynchronously as well.
The asynchronous behavior of the zenjmx daemon is achieved through the J2SE 5.0 Concurrency APIs documented in java.util.concurrent. Unlike Twisted, these APIs are thread-centric. Zenjmx is a multi-threaded application where an individual thread is created for each request to a JMX agent. Another thread is created to asynchronously process the result.
The timeout for each individual JMX call is configurable via the "jmxTimeOut" property in ${ZENHOME}/etc/zenjmx.conf. You can also control the thread pool size used when dispatching queries to agents by adjusting the "jmxPoolSize" property. By adjusting the jmxPoolSize property you control how many outstanding requests can be in-flight at any given time.
ZenJMX will attempt to use as many of the threads in the pool as possible, and will eventually block and wait until a thread is free before dispatching another request. That is, if the jmxPoolSize is set to 10 and there are currently 10 outstanding requests, the call to issue the 11th request will block until either 1 of the 10 outstanding requests returns or until the jmxTimeOut expires on 1 of the 10 outstanding requests and the thread is freed.
You should adjust the jmxPoolSize and jmxTimeOut values based upon your operating environment. In large java-centric facilities where a lot of Zenoss host resources can be devoted to running zenjmx you may consider increasing the jmxPoolSize to a very large value in order to reduce your cycle time. If you are confident that your network connectivity to your JMX Agents is strong, and the hosts on which your JMX Agents reside are fast, you may consider reducing the jmxTimeOut to a smaller value. By doing so you reduce your cycle time, but you also run into the potential problem of losing data that just took a long time to return to you.
Please note that ZenJMX periodically "injects" a collection cycle into the reactor. These injections occur on a regular periodic basis that is based on the snmp cycle time of the performance collector zenjmx is associated with, or on the value read from the cycleTime property defined in ${ZENHOME}/etc/zenjmx.conf. The injection process is an asynchronous and scheduled event it will occur on a regular basis even if the JMX dipatcher thread pool is filled with in-flight queries.
You can get yourself into a bit of a jam if you monkey around with the cycleTime and jmxTimeOut values too much. You want to avoid setting the cycleTime to be lower than the jmxTimeOut. If you set the cycleTime to be lower than the jmxTimeOut, and if you have JMX Agents on the network that are slow to respond, you can get zenjmx into an ever-increasing resource constraint as more and more JMX request threads will be occupied servicing queries from previous cycles. As a result we highly recommend setting the cycleTime to be greater than the jmxTimeOut.
After zenjmx retrieves information from a JMX agent it sends an XML-RPC request to ZenHub to store the performance information. This asynchronous operation occurs for each value read from a JMX Agent.
Lastly, ZenJMX heartbeats after each collect cycle via XML-RPC to ZenHub to let Zenoss know that ZenJMX is still alive and well.
The zenjmx daemon can be started by running "${ZENHOME}/bin/zenjmx start". Output from zenjmx is logged to ${ZENHOME}/log/zenjmx.log". ZenJMX uses Apache's Log4J for logging, and the verbosity in the logfile can be dramatically reduced by adjusting the log4j.properties file stored in ${ZENHOME}/Products/ZenJMX. You can also set up the LOGFILE appender in log4j.properties to use a rolling logfile rather than a continuously appended logfile. See the Apache Log4J documentation on how to perform that task.
You can also run zenjmx in the foreground by running "${ZENHOME}/bin/zenjmx run". Additional parameters (such as --cycle or --cycleTime) can be provided after the "run" or "start" command. This is consistent with how other Zenoss daemons behave.
Most users will want to start the ZenJMX daemon in the background using the "${ZENHOME}/bin/zenjmx start" command and immediately follow that up with "tail -f ${ZENHOME}/log/zenjmx.log" to see what ZenJMX is doing. Debugging mode is enabled by default and results in the printing of aggregate collection statistics across multiple cycles. This gives you an idea of how successful (or unsuccessful) ZenJMX has been at collecting values from JMX Agents.
Custom JMX Data Sources allow system administrators to monitor any attribute or operation result accessible via a JMX call. ZenJMX creates a "JMX" Data Source and allows you to provide Object information, as well as authentication settings, and attribute/operation information. Determining which object and attribute names, as well as which operations to invoke, is the key to customizing ZenJMX.
Start off by creating a new Performance template at the /Device level. The performance templates associated with a device are accessible viathe More->Templates link when looking at a device's page. Click the second down arrow and select "Add Template". Provide a descriptive name for the template, such as "JVM Values". After the template is created click on it. You should now be looking at the "JVM Values" performance template.
Click the down arrow next to Data Sources and select "Add Data Source". Provide a descriptive name of the JMX value you wish to retrieve. In our case we are interested in memory inforamtion so set the ID to "Heap Memory". Set the Type to JMX.
Enter the JMX Management Port (note: this is NOT necessarily the same as the listen port for your server!) and Object Name. The Object Name is also referred to as the MBean name. Enter "java.lang:type=Memory" as the Object Name. If your JMX Agent requires authentication provide the username and password.
Enter "HeapMemoryUsage" as the Attribute Name. Then add gauge data 425 points named "committed", "max", and "used". Click Save.
Lastly, add graphs that reference these new data points. Unfortunately ZenJMX will either need to be restarted in order to find out about your newly added data source, or you will need to wait for the configCycleTime to expire. Most performance collectors have a configCycleTime set to 60 minutes, meaning ZenJMX will check in every 60 minutes to get a list of updated JMX data sources and devices.
Please review "Interrogating an JMX Agent via JConsole" to learn how to determine the object name, attribute name, and data points that might be interesting in your application.
Each application server has a slightly different process for enabling remote JMX Access. It's best to consult with your application server for specific instructions. We've included instructions for a few commonly used configurations below.
The JAVA_OPTS environment variable can be used to enable remote access to JVM MBeans. Set it as follows:
JAVA_OPTS="-Dcom.sun.management.jmxremote.port=12345
JAVA_OPTS="${JAVA_OPTS} -Dcom.sun.management.jmxremote.authenticate=false"
JAVA_OPTS="${JAVA_OPTS} -Dcom.sun.management.jmxremote.ssl=false"

export JAVA_OPTS
When starting an application pass the JAVA_OPTS variable as an argument to the JVM as follows:
java ${JAVA_OPTS} -classpath /path/to/your/application.jar com.yourcompany.Main
You can then use JConsole to connect to localhost:12345. Authentication can be configured by modifying the java.security file as well as java.policy. There are lots of examples available on the Internet that can provide guidance in how to achieve authenticated remote access to JVM MBeans.
The same JAVA_OPTS approach can be used to enable remote access to Tomcat MBeans. Set the JAVA_OPTS variable as illustrated above and then execute the "./catalina.sh start" command in ${TOMCAT_HOME}/bin.
Note that Tomcat 6.0.14's catalina.sh does not process the "stop" command properly when the JAVA_OPTS variable is set. We recommend using 2 separate shells when troubleshooting JMX problems in Tomcat: one for starting Tomcat (with the JAVA_OPTS variable set) and a different one for stopping Tomcat (where the JAVA_OPTS variable is not set).
JBoss uses the JAVA_OPTS approach for enabling remote access to beans. However, it requires some additional properties. To set up your JAVA_OPTS for use in JBoss see the following code segment:
JAVA_OPTS="-Dcom.sun.management.jmxremote.port=12345"
JAVA_OPTS="${JAVA_OPTS} -Dcom.sun.management.jmxremote.authenticate=false"
JAVA_OPTS="${JAVA_OPTS} -Dcom.sun.management.jmxremote.ssl=false"
JAVA_OPTS="${JAVA_OPTS} -Djboss.platform.mbeanserver"
JAVA_OPTS="${JAVA_OPTS} -Djavax.management.builder.initial=org.jboss.system.server.jmx.MBeanServerBuilderImpl"
export JAVA_OPTS
When you start JBoss via the run.sh you must also pass the "-b 0.0.0.0" argument:
cd ${JBOSS_HOME}/bin
./run.sh -b 0.0.0.0
JMX actually uses 2 separate ports for MBean access: one is used for initial connection handling and authentication, and the other is used for RMI access. During the handshake between a JMX Client and the JMX Agent the agent tells the client the IP address and port number for the RMI registry. By default JBoss sets the IP address to 127.0.0.1. This works when the JMX client and the JMX agent reside on the same device, but it won't work in a distributed environment.
By passing the "-b 0.0.0.0" argument you instruct JBoss to bind to all available network ports, and this results in the JMX Agent's handshaking logic using a network reachable address when informing clients of the RMI registry hostname and port.
JSR-160 standardized remote access to JMX Agents, and allows for any client to connect to an JMX Agent using classes packaged with the JDK. WebLogic versions prior to 9.0 required clients to use a WebLogic JMX client library that used a proprietary protocol to interact with the JMX Agent. You'll need to make sure you're running WebLogic 9.0 or higher in order to monitor it via ZenJMX.
If you're new to WebLogic and have not set up a domain and server you'll need to run the startWLS.sh script located in ${BEA_HOME}/wlserver_10.0/server/bin. If you don't have the Terminal I/O package installed you can set the JAVA_OPTIONS variable to the following value:
JAVA_OPTIONS="-Dweblogic.management.allowPasswordEcho=true"
export JAVA_OPTIONS
Provide a username and password to start WebLogic. Note that WebLogic requires a password that is at least 8 characters long. Wait for WebLogic to generate a configuration and start up. Shut down WebLogic and restart it with remote JMX access enabled.
To enable remote JMX acess set the following variable:
JAVA_OPTIONS="-Dcom.sun.management.jmxremote.port=12347"
JAVA_OPTIONS="${JAVA_OPTIONS} -Dcom.sun.management.jmxremote.authenticate=false"
JAVA_OPTIONS="${JAVA_OPTIONS} -Dcom.sun.management.jmxremote.ssl=false"
export JAVA_OPTIONS
Then re-run the ./startWLS.sh script. JConsole can then communicate with the server on port 12347.
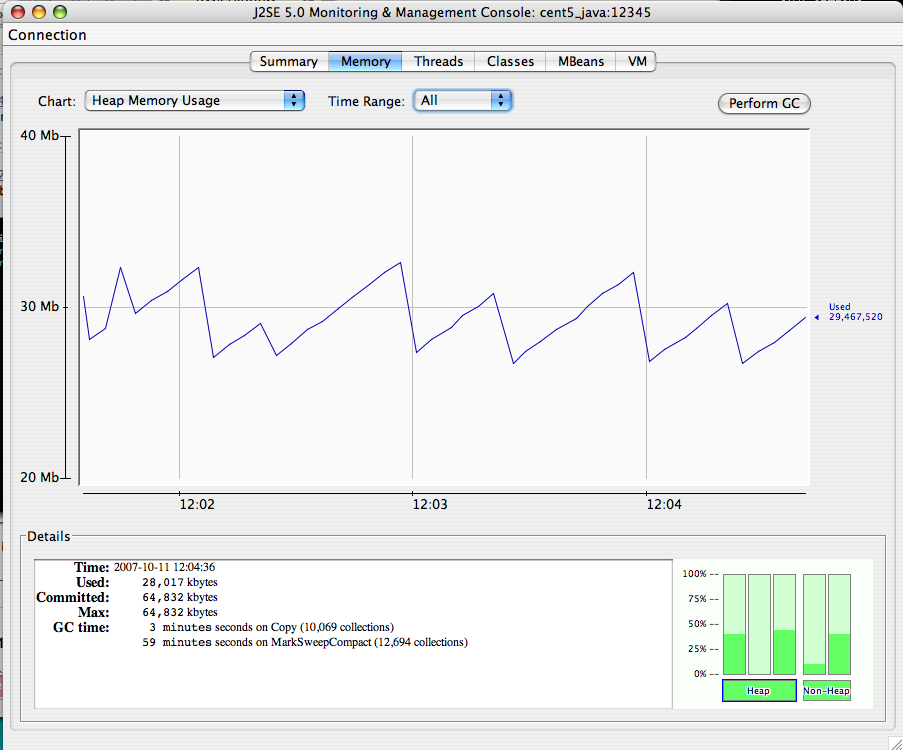
JConsole is a tool built into the JDK that allows system administrators to interrogate a JMX Agent and examine the MBeans deployed within the server. JConsole also allows administrators to view JVM summary information, including the amount of time the JVM has been running, how many threads are active, how much memory is currently used by the heap, how many classes are currently loaded, and how much physical memory exists on the machine.
JConsole also provides a graph that shows memory, thread, and class usage over time. The scale of the graph can be adjusted so that a system administrator can examine a specific period of time, or can zoom out to view a longer range picture of usage. Unfortunately, JConsole can only produce graphs that show usage while JConsole was running. Administrators cannot look back in time to a point where the JVM was running but JConsole was not monitoring the JVM.
The MBean tab along the top of JConsole provides an interactive method for examining MBean values. After clicking on the MBean tab a panel will be displayed with a tree on the left hand side. The tree contains a hierarchical list of all MBeans deployed in the JVM.
The standard JVM MBeans are all in the java.lang and java.util.logging packages. Application server specific MBeans do not follow any standard naming pattern. Some vendors choose to use package names for their MBean names while other vendors choose package-like names (but not fully qualified packages).
To get started expand the java.lang node in the Tree. This will expose several MBeans as well as additional folders. Click on the Memory MBean and observe how the right hand side of the panel is populated with information about the Memory MBean.
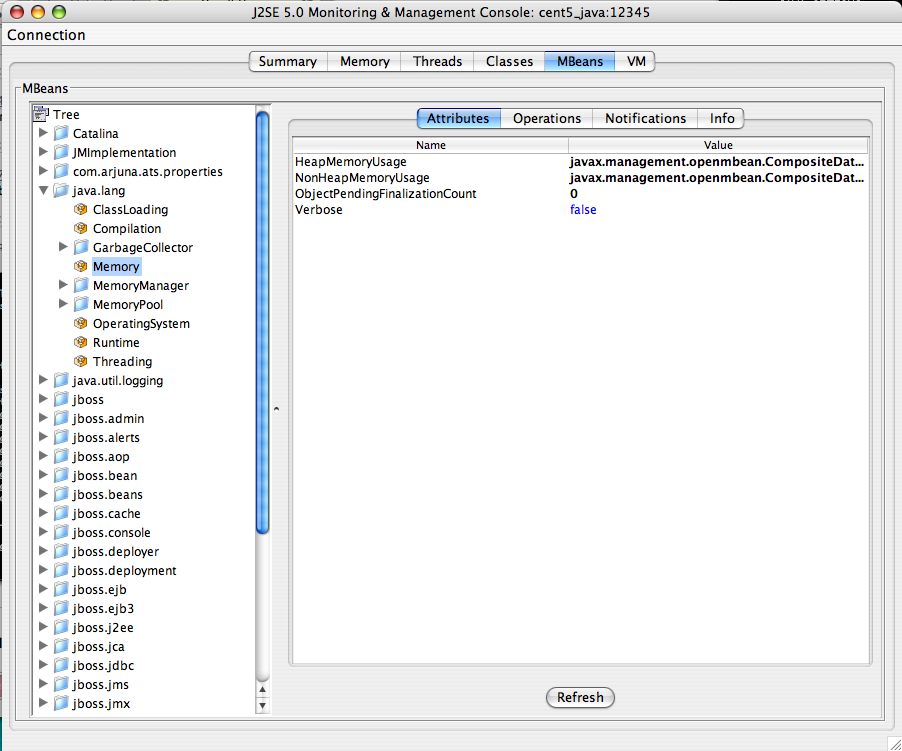
MBeans can contain attributes and operations. MBeans can also fire notifications to observers, but that's beyond the scope of this document. The attributes tab lists all of the attributes in the first column and their values (or a clickable attribute type) in the second column. In the case of Memory the HeapMemoryUsage is a Composite attribute, otherwise referred to as a "multi-value attribute" in Zenoss. Double click the "javax.management.openmbean.CompositeDataSupport" type and you will see multiple attributes appear. The show the amount of committed, maxiumum, and used memory sizes for the heap.
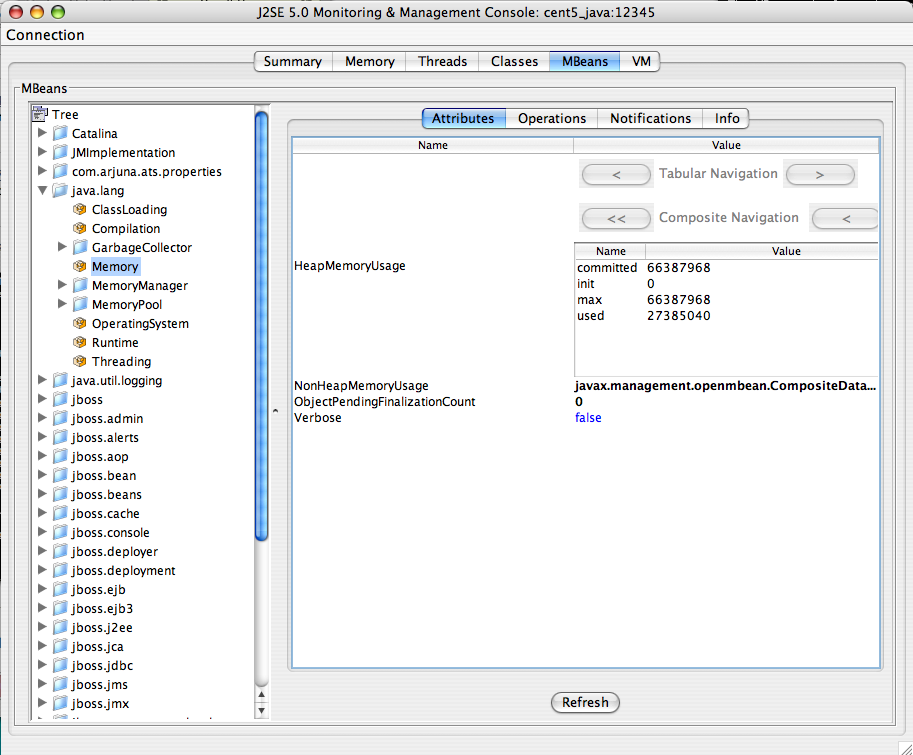
The unique name of the MBean can be viewed by clicking on the Info tab. The first value is MBean Name and it's value in the case of Memory is: "java.lang:type=Memory". Note that there isn't a standardized way to name MBeans and application server vendors do it differently.
You can also examine operation information by clicking on the Operations tab. These are methods that JConsole can remotely invoke on an MBean that will result in some value being computed or some state changing in the application. The Threading MBean has several operations that can be invoked that return information. Click on the java.lang package and then click on the Threading operation. Lastly, click on the Operations tab. Methods like "getThreadUserTime" are invocable.
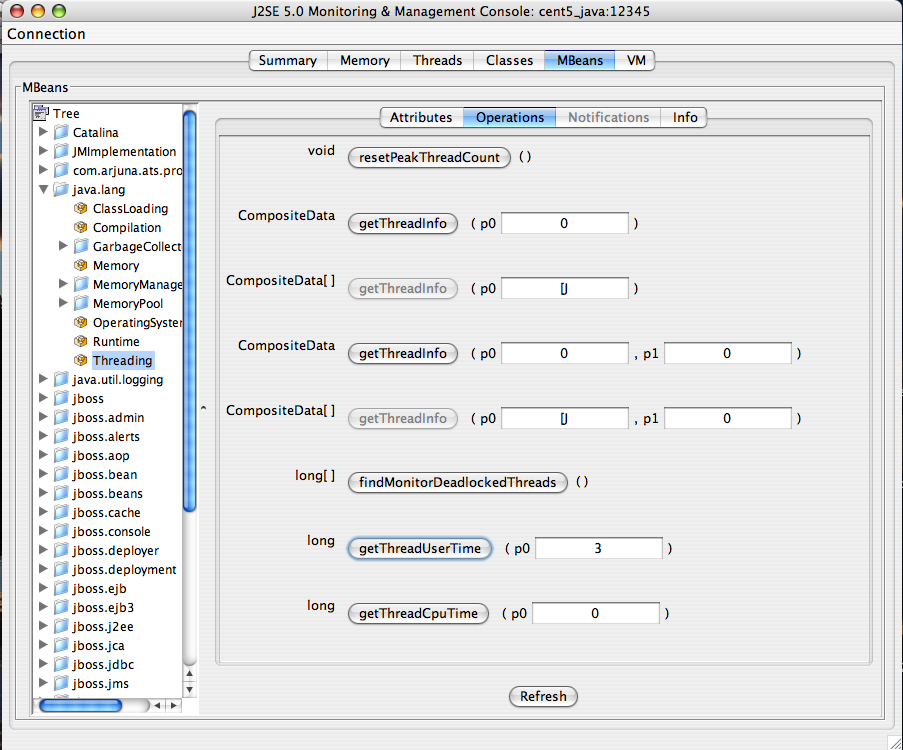
Test the "getThreadUserTime" method by changing the p0 parameter to 1 and clicking the "getThreadUserTime" button. A dialog window will be raised that displays the amount of CPU user time thread #1 has used. Try adjusting the parameter to different values to observe the different CPU times for the threads.
Step #1: Install the ZenJMX ZenPack
ZenJMX is installed using the "zenpack" command. As the zenoss user 6 run the following command:
${ZENHOME}/bin/zenpack --install /path/to/ZenJMX-1.0.0-el5-i386.zip
Step #2: Install Sun's JRE
You will need Java SE Version 5.0 or higher. 1.4.2 will NOT work. We have not tested with gcc-java. Make sure that after you install Sun's JRE you update your PATH such that the "java" executable works. You can test this using the command "which java" - if it returns a fully qualified path to java you have successfully installed Java.
ApacheMonitor provides a method for pulling performance metrics from the Apache HTTP Server (http://httpd.apache.org/) directly into Zenoss without requiring the use of an agent. This is accomplished by utilizing the standard mod_status module that comes with version 1 and 2 of the HTTP server.
The following metrics will be collected and graphed for the Apache HTTP Server.
-
Requests per Second
-
Throughput (Bytes/sec & Bytes/request)
-
CPU Utilization of the HTTP server and all worker processes/threads
-
Slot Usage (Open, Waiting, Reading Request, Sending Reply, Keep-Alive DNS Lookup and Logging)
Follow these steps to setup your HTTP server so that it will allow Zenoss to access the server status.
-
On the Apache server, find your httpd.conf file. This is normally located in /etc/httpd/httpd.conf or /etc/httpd/conf/httpd.conf. Other locations are possible depending on your operating system and setup.
-
Turn the ExtendedStatus option on in the httpd.conf file. This option will typically be commented out. You can enable it by uncommenting it.
#ExtendedStatus on
... becomes ...
ExtendedStatus on
-
Enable the /server-status location in the httpd.conf file. This is another option that typically already exists but is commented out.
#<Location /server-status>
#    SetHandler server-status
#    Order deny,allow
#    Deny from all
#    Allow from .example.com
#</Location>
... becomes ...
<Location /server-status>
SetHandler server-status
Order deny,allow
Deny from all
Allow from zenoss.yourdomain.com
</Location>
-
Save the httpd.conf file with these changes then restart httpd. This can be accomplished with following command.
apachectl restart
Once your Apache HTTP Server is configured to allow Zenoss to access the extended status, you can add Apache monitoring to the device within Zenoss by simply binding the Apache template to the device.
-
Navigate to the device in the Zenoss web interface.
-
Click the device menu, choose More then Templates.
-
Click the templates menu, choose Bind Templates.
-
Ctrl-click the Apache template from /Devices/Server to choose it.
-
Click OK.
You will now be collecting the Apache HTTP Server metrics from this device.
DellMonitor provides custom modeling of devices running the Dell OpenManage agents. It also contains hardware identification for Dell proprietary hardware. The information is collected through the SNMP interface.
The following information is modeled:
-
Hardware Model 11
-
Hardware Serial Number
-
Operating System
-
CPU Information (socket, speed, cache, voltage)
-
PCI Card Information (manufacturer, model)
HPMonitor provides custom modeling of devices running the HP/Compaq Insight Management Agents. It also contains hardware identification for HP proprietary hardware. The information is collected through the SNMP interface.
The following information is modeled.
-
Hardware Model
-
Hardware Serial Number
-
Operating System
-
CPU Information (socket, speed, cache)
MySqlMonitor provides a method for pulling performance metrics from the MySQL database server (http://www.mysql.com/) directly into Zenoss without requiring the use of an agent. This is accomplished by utilizing the MySQL client library to connect to the database remotely.
The following metrics will be collected and graphed for MySQL server.
-
Command Statistics (SELECT, INSERT, UPDATE, DELETE)
-
Select Statistics (Scan, Range Check, Range Join, Full Join)
-
Handler Statistics (Keyed & Unkeyed Reads, Writes, Updates, Deletes)
-
Network Traffic (Received & Sent)
Follow these steps to setup your MySQL server to allow Zenoss to read performance data from the system tables.
-
Connect to the MySQL database using the MySQL client.
mysql -u root
... or if there is a MySQL root password ...
mysql -u root -p
-
Grant the Zenoss server full privileges.
mysql> GRANT ALL PRIVILEGES ON *.* TO root@'zenoss.yourdomain.com'
-> IDENTIFIED BY 'mySqlRootPassword';
Query OK, 0 rows affected (0.00 sec)

mysql> FLUSH PRIVILEGES;
-
Edit the zMySqlRootPassword zProperty for the device(s) within Zenoss that you intend to monitor MySQL on.
-
Bind the MySQL template to the same device(s).