Administration Guide
The following diagram illustrates Zenoss' system architecture.
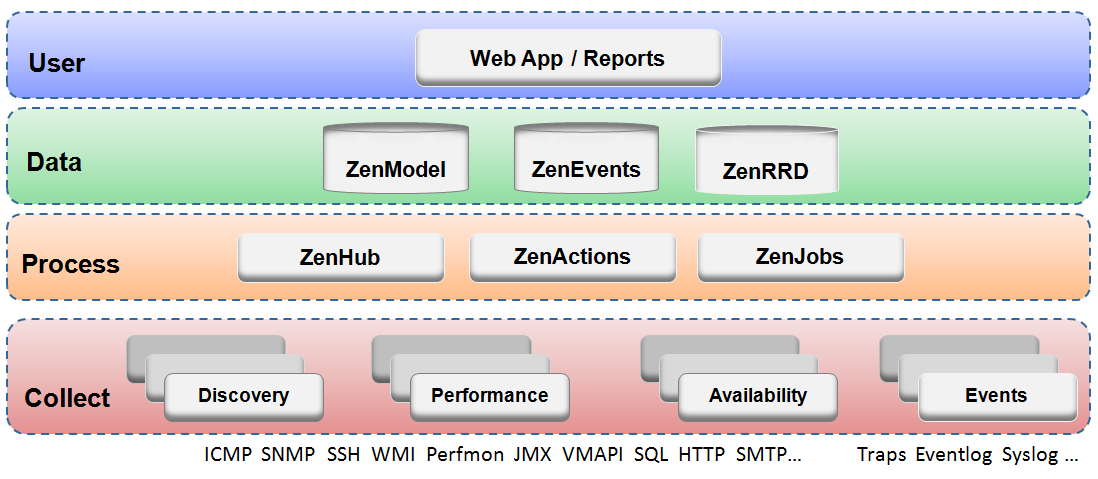
Zenoss is a tiered system with four major parts:
User layer
Data layer
Processing layer
Collection layer
Built around the Zope Web application environment, the user layer is manifested as a Web portal. It uses several JavaScript libraries, Mochi Kit, YUI, and extJS to provide a rich application experience.
Through the user interface, you access and manage key Zenoss components and features. From here, you can:
Watch the status of your enterprise, using the Zenoss Dashboard
Work with devices, networks, and systems
Monitor and respond to events
Manage users
Create and run reports
The user layer Interacts with the data layer and translates the information for display in the user interface.
Zenoss configuration and collection information is stored in the data layer, in three separate databases:
ZenRRD - Utilizing RRDtool, stores time-series performance data. Because RRD files are stored locally to each collector, no bottlenecks result from writing to a single database as new collectors are added.
ZenModel - Serves as the core configuration model, which comprises devices, their components, groups, and locations. It holds device data in the ZEO back-end object database.
ZenEvents - Stores event data in a MySQL database.
The process layer manages communications between the collection and data layers. It also runs back-end, periodic jobs, as well as jobs initiated by the user (ZenActions and ZenJobs).The process layer utilizes Twisted PB (a bi-directional RPC system) for communications.
Zenoss' collection layer comprises services that collect and feed data to the data layer. These services are provided by numerous daemons that perform modeling, monitoring, and event management functions.
The modeling system uses SNMP, SSH, and WMI to collect information from remote machines. The raw information is fed into a plugin system (modeling plugins) that normalizes the data into a format that matches the core Zenoss model.
Monitoring daemons track the availability and performance of the IT infrastructure. Using multiple protocols, they store performance information locally in RRD files, thus allowing the collectors to be spread out among many collector machines. Status and availability information, such as ping failures and threshold breaches, are returned through ZenHub to the event system.
For more information about Zenoss daemons, see the appendix titled "Zenoss Daemon Commands and Options."