Zenoss' uses a unique, model-driven approach to monitoring, combining discovery and the model to enable automatic monitoring. This strategy reduces system maintenance overhead and ensures that new devices and applications are monitored as they come online.
As shown in the previous illustration, model-driven monitoring begins with discovery, which populates the model. It continues as the configuration defined in the model is automatically applied and monitoring begins. As the system runs, the configuration is further fine-tuned.
Zenoss model-driven monitoring approach is demonstrated by the following file system monitoring scenario.
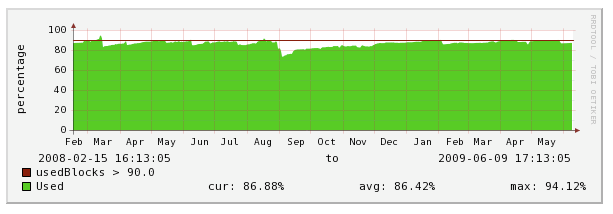
By default, Zenoss is configured with a file system threshold of 90% utilization. Each time Zenoss discovers a file system, this threshold is automatically applied to the file system, and monitoring begins.
This illustration shows the result of a system being monitored, using the default configuration. The graph shows that the threshold of 90% has been exceeded numerous times. Because the data in the model is normalized, thresholds will apply regardless of the collection mechanism (SNMP, SSH, and WMI).
The chapter titled "Properties and Templates" provides more information about modifying Zenoss' monitoring configuration.


