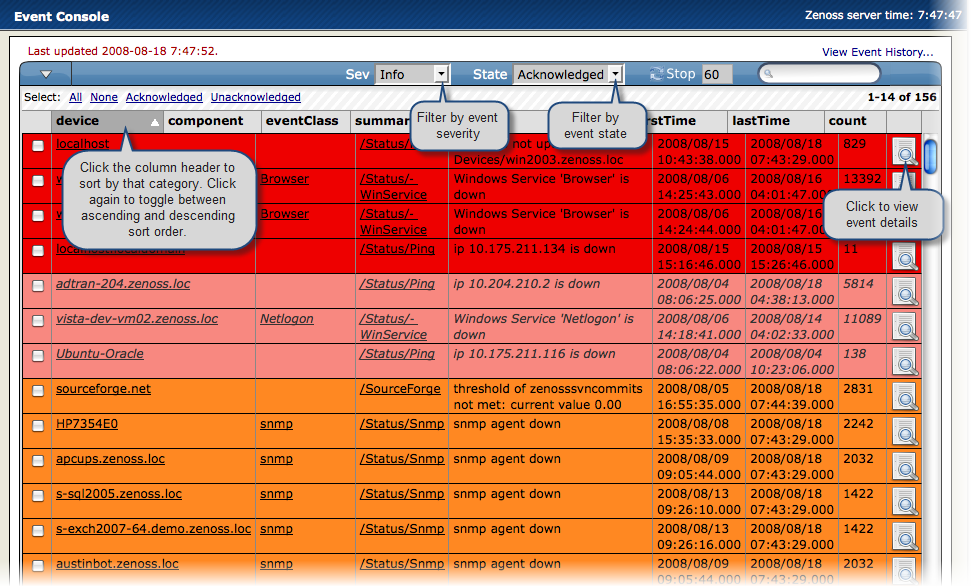
The event console is Zenoss' central nervous system, enabling you to view and manage events. It displays the repository of all events that are detected by the system.
To access the event console, click Event Console in the Navigation menu.
You can sort events that appear in the event console by:
Device
Component
Event class
Summary
First time the event was detected (firstTime)
Last time the event was detected (lastTime)
Number of times the event was detected (Count)
To sort events by a category, click a column header. Clicking the header toggles between ascending and descending sort order.
You can filter the list of events that appear in the list by:
Severity - Select to filter by Critical, Error, Warning, Info, Debug, or Clear. By default, severity level is set to Info.
State - Select to filter by new, acknowledged, or suppressed events. By default, state is set to Acknowledged.
When you select a severity, the list shows events at the selected level and higher. For example, if you choose to filter events by Severity level Error, only those events with severity levels of Error and Critical appear.
The list of events automatically refreshes according to the value specified next to the Stop button (located at the top of the events list). Change this value (by default, 60 seconds) to refresh more or less frequently. To stop auto-refresh, click Stop. Click this button again to restart auto-refresh.
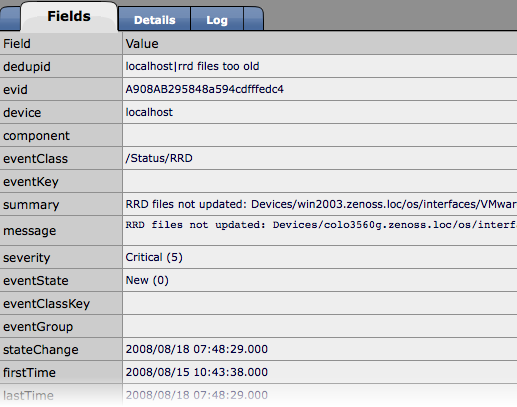
You can view details for any event in the system. To view details, click the magnifying glass in the right-most column of an event row. The Event Detail window appears, showing the Fields tab.
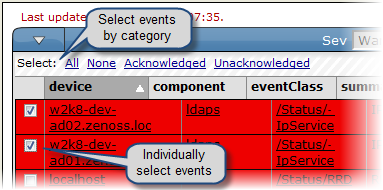
To select one or more events in the list, you can:
You can manage events from the event console. After selecting an event, you can:
Acknowledge the event
Move the event to history
Map the event to a specific location
You can navigate to the component where an event was triggered. Click a component in the list to go to its Device Status page.


