Extended Monitoring Guide
In Zenoss, metric-bearing VMware entities (such as Hosts, Guests, and Clusters) have associated templates. These templates define which metrics are gathered. By default, only a subset is collected; however, you can add more by adding data sources to the templates. Once created, you can then create custom graphs from these data sources.
To create a custom data source:
Select the template to which you want to add the data source.
From the DataSources list of options, select Add Datasource.
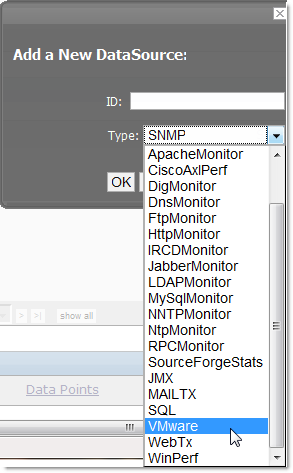
The Add DataSource dialog appears.
Select the
VMwaredata source from the list of options.Enter or select values to create the data source:
- Not used.
- Not used.
, , and - VMware-specific data points are determined by this trio of strings. For information about each of these metrics, see the chapter titled "Performance Counters Reference" in the VI SDK Programming Guide .
- Certain metrics are further specified by an instance name. For example, the metric whose Group/Counter/Rollup Type triplet is Network/Network Data Receive Rate/average requires the name of the actual interface for full specification. In Zenoss, this metric is represented by the data source nicRx on the template VMwareNic. The VMwareNic template is bound to the individual host interfaces, each of whose ID is the interface name. In this case, the instance name is ${here/instanceId}.
Click to save the new data source.