Monitoring
Monitoring in Zentyal
The monitor module allows the administrator to know the status of the resources usage from the Zentyal server. This information is essential to both troubleshoot and plan in advance the necessary resources in order to avoid problems.
The monitoring is done through graphics which let know the evolution of resource usage. We will see those graphics from menuselection:Monitor. Placing the cursor somewhere over the line on the graph which we are interested in we can know the exact value for a given instant.
We can choose the time scale of the graphs within an hour, a day, month or year. To do this simply click on the desired tab.
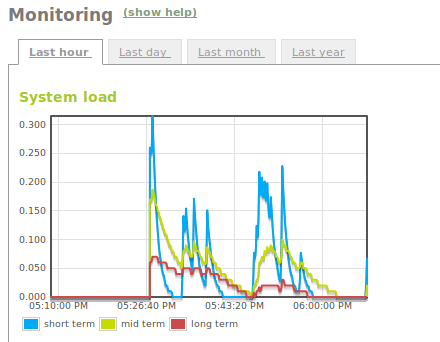
Tabs with the different monitoring reports
Metrics
System load
The system load tries to measure the rate of pending work over the completed work. This metric is defined as the number of runnable tasks in the run-queue and is provided by many operating systems as a one, five or fifteen minutes average.
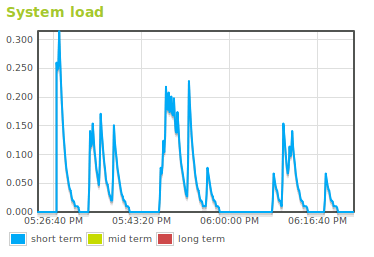
System load graphic
CPU usage
This graph shows detailed information of the CPU usage. In the case of having a multi-core or multi-cpu machine you will see one graph for each core.
This graph represents the amount of time that the CPU spends in each of its states: running user code, system code, inactive, input/output wait, and so on. This time is not a percentage, but scheduling units known as jiffies. In most Linux systems this value is 100 per second, but nothing guarantees it may differ.
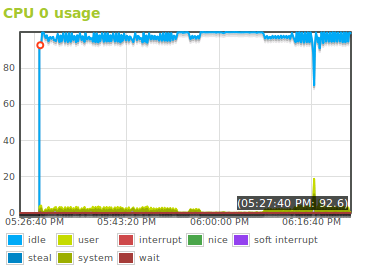
CPU usage graph
Memory usage
This graphs shows the memory usage. The following variables are monitored:
- Free memory:
- Amount of memory not used
- Page cache:
- Amount of memory that is cached in disk swap
- Buffer cache:
- Amount of memory that is cached for input/output operations
- Memory used:
- Amount of memory that is not included in any of the above
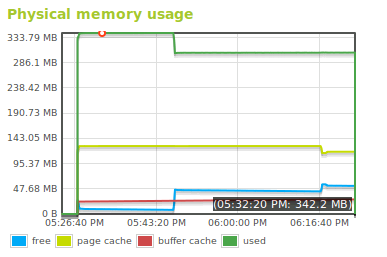
Memory usage graphic
File system usage
This graph displays the used and free space of every mounting point.
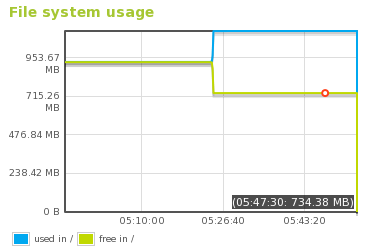
File system usage graphic
Temperature
This graph allows you to know the system temperature in degrees Celsius by using the ACPI system [1]. In order to enable this metric, it is required the server has this system and the kernel supports it.
| [1] | Advanced Configuration and Power Interface (ACPI) is an open standard to configure devices focused on operating systems and power management. http://www.acpi.info/ |
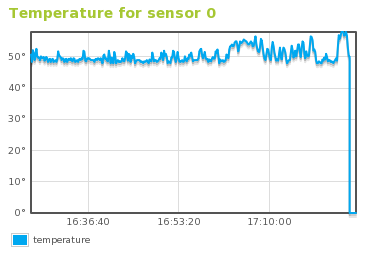
Temperature sensor diagram graphic
Alerts
The monitoring would be largely deprived of income if it does not go along with a notification system to warn us when uncommon values are produced, letting us know when the host is suffering from an unusual load or is nearing maximum capacity.
Monitor alerts are configured in Events module. Go to Events ‣ Configure Events, we can see the full list, the relevant events are grouped in the Monitor event.
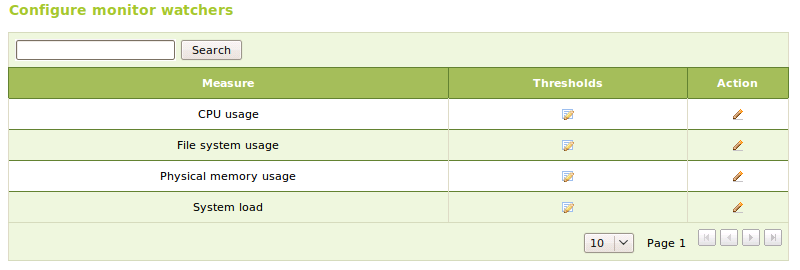
Configuration screen for the monitor observers
Clicking on the cell configuration, you access to this event configuration. We can choose any of the monitored metrics and establish thresholds which trigger events.
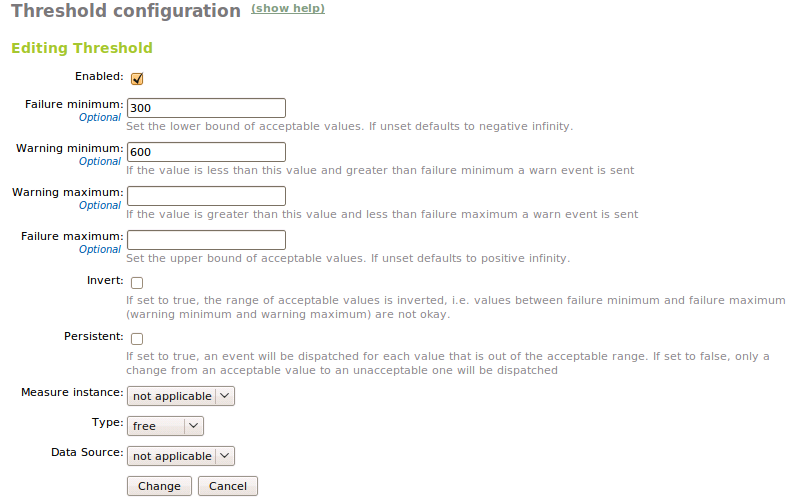
Configuration screen for event thresholds
There are two different thresholds, warning and failure, this allows the user to filter based on the event severity. You can use the option reverse: to swap the values that are considered right and wrong. Other important option is persistent:. Depending on the metric we can also set other parameters, for instance, you may receive alerts for the free space in hard disk metric, or the short term load in system load metric and so on.
Each measure has a metric that it is described as follows:
- System load:
- The values must be set in average number of runnable tasks in the run-queue.
- CPU usage:
- The values to set must be jiffies or units of scheduling.
- Physical memory usage:
- The values to set must be bytes.
- File system:
- The values must be set in bytes.
- Temperature:
- The values to set must be grades.
Once you have configured and enabled the event you will need to configure, at least, one observer. The observer configuration is the same as the configuration of any other event. Check the Events and alerts chapter for further information.