| Red Hat Docs > Manuals > EDK Manuals > |

To work with Embedded DevKit's visual debugger, Insight, see the following documentation and Insight's Help menu for discussion of general functionality and use of menus, buttons or other features.
Having an inactive debugging session open when starting another debugging session with EDK will close all projects. All work will be unrecoverable.
When Insight first launches, it displays an empty Source Window (Source Window).
The menu selections in the Source Window are File, Run, View, Control, Preferences and Help. See Source Window Menus and Display Features for more descriptions of the Source Window. To work with the other windows for debugging purposes specific to your project, use the View menu or the buttons in the toolbar and see the following documentation.
To open a specific file as a project for debugging, select File -> Open in the Source Window. The file's contents will then be passed to the GDB interpreter for execution. To start debugging, click the Run button (Run button) from the Source Window.
When the debugger runs, the button turns into the Stop button (Stop button). The Stop button interrupts the debugging process for a project, provided that the underlying hardware and protocols support such interruptions. Generally, machines that are connected to boards cannot interrupt programs on those boards, so the Stop button has no functionality (it will appear unavailable, or "grayed out"). For more information on the toolbar buttons, see Default style toolbar.
When debugging a target, do not click on the Run button during an active debugging process, or it will de-activate the process. The Run button will become the Stop button and Insight will lose connection with the target.
To specify preferences of how source code appears and to change debugging settings, select Preferences -> Source from the Source Window. The Source Preferences dialog opens (Source Preferences dialog).
Left-click any of the colored squares to open the Choose color dialog, with which you modify the display colors of the Source Window.
Mouse Button-1 Behavior sets and clears either breakpoints or tracepoints (points in the source code, with an associated text string); the default is for setting breakpoints.
Variable Balloons lets you display a balloon of text whenever the cursor is over a variable in the Source Window; the balloon displays the value of the variable (see Breakpoint information balloon for an example). On is the default selection.
Selecting Tab Size sets the number of spaces for a tab character in the Source Window.
The Source Window has the following functionality and display features when using the Source Preferences dialog settings.
When the executable is running in a debugging process, the location of the current program counter displays as a line with a colored background (PC).
When the executable has finished running, the background color changes (Browse).
When looking at a stack backtrace, the background color changes to another different color (Stack).
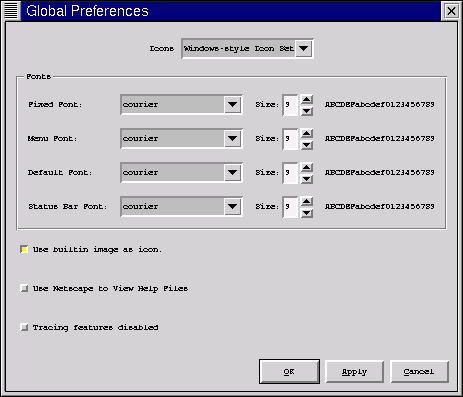
To set other preferences for a debugging session, select Preferences -> Global from the Source Window. The Global Preferences dialog opens (Global Preferences dialog) where you select a specific font and type size for the text in the windows for Insight.
Icons allows you to select the appearance of the toolbar buttons as the Windows-style Icon Set (the default; see Default style toolbar) or the Basic Icon Set (see Insight's Help menu for more information).
Fonts is for selecting font family and size.
Use builtin image as icon to change your host default settings for the Insight session icon on your desktop.
Use Netscape to View Help Files provides Netscape as your default browser for Insight's Help documentation.
Tracing features disabled disables setting tracepoints.
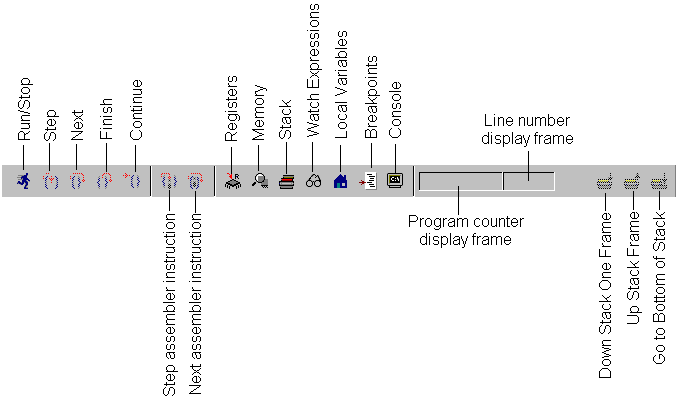
The following descriptions discuss the use of the default debugger toolbar buttons.
|
The left-hand read-only frame displays the program counter
(pc) of the current frame. |
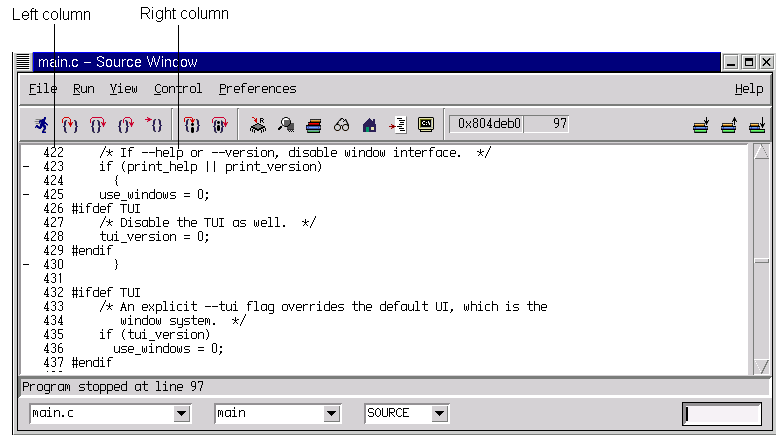
The mouse has many uses within the main display pane of the Source Window. Divided into two columns (Using the mouse in the Source Window), the window's left column extends from the left edge of the display pane to the last character of the line number, while the right column extends from the last character of the line number to the right edge of the display pane. Within each column, the mouse has different effects (see the following descriptions for Left column functionality for the Source Window and Right column functionality for the Source Window).
Using the mouse in the Source Window
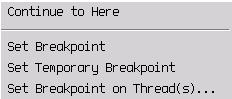
When the cursor is in the left column over an executable line, it appears as a minus sign. When a breakpoint is set at this point, the cursor changes into a circle. A left click sets a breakpoint at the current line; the breakpoint appears as a colored square in place of the minus sign. A left click on any existing or temporary breakpoint removes that breakpoint. A right click on any existing or temporary breakpoint brings up a pop-up menu (Pop-up menu for setting breakpoints).
Pop-up menu for setting breakpoints
Continue to Here causes the program to run up to a location, ignoring any breakpoints; like the temporary breakpoint, this menu selection displays as a differently shaded square than a regular breakpoint. When a breakpoint has been disabled, it turns, for instance, from red or orange to black (color settings vary depending on the preferences you set; see also Source Preferences dialog and its accompanying descriptions). Set Breakpoint sets a breakpoint on the current executable line; this has the same action as left clicking on the minus sign. Set Temporary Breakpoint sets a temporary breakpoint on a current executable line; a temporary breakpoint displays as a differently shaded square than a regular breakpoint, and is automatically removed when hit. Set Breakpoint on Thread(s) sets a thread-specific breakpoint at the current location.
Right-click on a line with a breakpoint to invoke a pop-up menu to delete breakpoints (Pop-up menu for deleting breakpoints).
Pop-up menu for deleting breakpoints
Delete Breakpoint deletes the breakpoint on the current executable line. This has the same action as left clicking on the colored square; see the description for Continue to Here for Pop-up menu for setting breakpoints. With the cursor over a line, a breakpoint opens a breakpoint information balloon; see Breakpoint information balloon for an example of such a tool tip.
Breakpoint information balloon
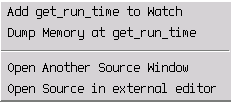
The following documentation discusses the functionality of how the mouse works in the right column of the Source Window. With the cursor over a global or local variable, the value of that variable displays. With the cursor over a pointer to a structure or class, view the type of structure or class and the address of the structure or class. Double clicking an expression selects it. Right clicking an expression invokes a pop-up menu (Pop-up window for expressions).
Add <selected expression> to Watch opens the Watch Expressions window (<selected expression> in the example was get_run_time) and adds a variable expression to the list of expressions in the window. Dump Memory at <selected expression> opens the Memory window, which displays a memory dump at an expression. Open Another Source Window opens another Source Window for displaying a program in an alternate format (see Code display drop-down list box and its accompanying descriptions). Open Source in external editor opens the program in an alternate editor, such as the Source-Navigator Editor (see Using the Editor).
The Source Window has the following menu items, many of which correspond to the toolbar buttons (see Default style toolbar).
File has the following menu items. Edit Source allows direct editing of the source code. Open invokes the Load New Executable dialog. Source invokes the Choose GDB Command file dialog. Exit closes the Insight interface.
Run has the following usage. Attach to Process attaches thread processes for debugging (see Using the Processes Window for Threads). Download downloads an executable to a target. Run runs the executable.
View displays the following windows: Stack (Stack window), Registers (Registers window), Memory (Memory window), Watch Expressions (Watch Expressions window), Local Variables (Local Variables window), Breakpoints (Breakpoints window), Console (Console window), Function Browser (Function Browser window), and Processes (for threads, use Threads List; see Process window for displaying state of threads).
Control has the following usage. Step steps to next executable line of source code and steps into called functions. Next steps to next executable line of source code in the current file and steps over called functions. Finish finishes execution of a current frame and, if clicked while in a function, finishes the function and returns to the line that called the function. Continue continues execution until a breakpoint, watchpoint or exception is encountered, or until execution completes. Step Asm Inst steps through one assembler machine instruction and steps into subroutines. Next Asm Inst steps to the next assembler instruction but steps over subroutines.
Preferences has the following usage. Global opens Global Preferences (Global Preferences window) for changing how text appears. Source opens the Source Preferences (Source Preferences dialog) to show how colors display.
Help has the following usage. Help displays the Help window (Help window showing the help topic's index). About GDB displays the version number, copyright notice and contact information for Insight to use for GDB.
There are four display and selection fields below the horizontal scroll bar: the status text box (Status text box), the file drop-down combo box (File drop-down list box), the function drop-down combo box (Function drop-down combo box) and the code display drop-down list box (Code display drop-down list box). At the top of the horizontal scroll bar, text details the current status of the debugger; the status text box in Status text box shows "Program stopped at line 19" as the message.
The Function Browser window provides even more powerful tools for locating files and functions within your source code; for more information, see Using the Function Browser Window.
The function drop-down list box (Function drop-down combo box) displays all the functions of a selected source (.c) or header (.h) file that an executable uses. Select a function by clicking in the list, or by typing directly into the text field for the function drop-down list box.
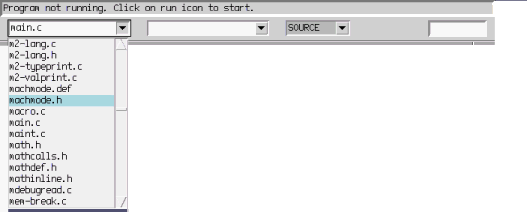
The file drop-down list box (File drop-down list box) displays the source (.c) and header (.h) files associated with an executable. Select files by clicking the arrow to the right of the drop-down list and then selecting one of the files in the list, or by typing the file's name directly into the list's text field.
Select how the code in the Source Window displays by using the code display drop-down list box (Code display drop-down list box).
Code display drop-down list box
The selections in the code display drop-down list box provide the following different ways to display code in the Source Window.
MIXED displays both source code and assembly code, interspersed within the Source Window.
SRC+ASM displays source code in one pane and assembly code in a separate pane of the Source Window.
Type a character string into the search text box (Search text box).
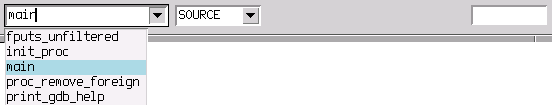
Press Enter to perform a forward search on the source file for the first instance of a specific character string. After having specified "main" in the search text box, the example program in Searching for a word in source code shows the jump to a main function.
Searching for a word in source code
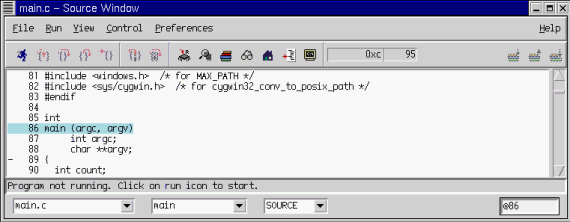
Use the Shift and Enter keys simultaneously to search for the string. Use the Enter key or the Shift and Enter keys to repeat the search. Type "@" with a number in the search text box and press Enter to jump to a specific line number in the source code. The example program in Searching for a specific line in source code shows a jump to the line 86.
Each time your program performs a function call, information about the call generates. That information includes the location of the call in your program, the arguments of the call, and the local variables of the function being called. The information is saved in a block of data called a stack frame. The stack frames are allocated in a region of memory called the call stack. When your program stops, you can examine the stack you to see this information.
A stack refers to the layers (TCP, IP, and sometimes others) through which all data passes at both client and server ends of a data exchange. The call stack is the data area or buffer used for storing requests that need to be handled, as in a list of tasks or, specifically, the contiguous parts of the data associated with one call to a specified function in a frame. The frame contains the arguments given to the function, the function's local variables, and the address at which the program is executing.
The Stack window displays the current state of the call stack (Stack window), where each line represents a stack frame; the line with the main.c executable had been selected for the example.
Click a frame to select or highlight that frame. The Source Window automatically shows the source code that corresponds to the selected frame. If the frame points to an assembly instruction, the Source Window changes to assembly code; the corresponding source line's background in the Source Window also changes to the stack color.
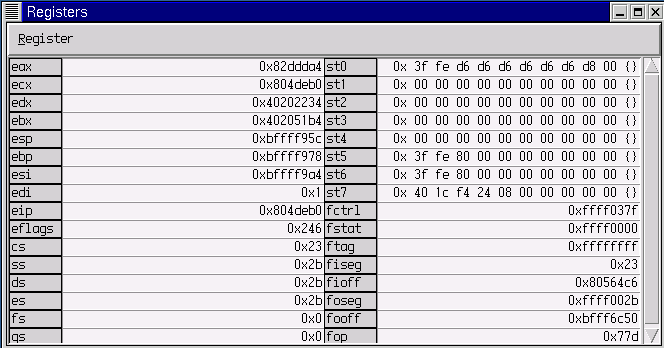
The Registers window (Registers window) dynamically displays registers and their contents.
To change the properties of registers, use the following methods.
To edit the contents of a register, double click on it. Alternatively, use Register -> Edit to change the contents after selecting a register. Use the Esc key to abort the editing.
Use Register -> Format to invoke another pop-up menu to display the contents of a selected register in Hex (Hexadecimal), Decimal, Natural, Binary, Octal, or Raw formats.
Hex is the default display format. Natural format refers to and Raw refers to. The other formats are self-explanatory.
Use Register -> Remove from Display to remove a selected register from the window; all registers will display if you close and reopen the window, unless you have already selected this feature.
Use Register -> Display All Registers to display all the registers; this menu item is only active when one or more registers have been removed from display.
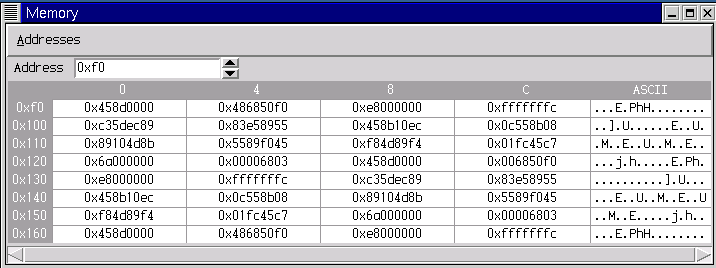
The Memory window (Memory window) dynamically displays the state of memory. Double-click a memory location with the cursor in the window and edit its contents.
Use Addresses -> Auto Update to update the contents of the Memory window automatically whenever the target's state changes; this is the default setting. Use Addresses -> Update Now to update the Memory window's view of the target's memory.
Memory Preferences dialog for the Memory window
Use Addresses -> Preferences to invoke the Memory Preferences dialog to set memory options.
Select the size of the individual cells to display with Size options; Byte, Half-Word, Word, Double-Word, Float, or Double-Float are the settings, with Word being the default selection.
Select the format of the memory that displays with Format options; Binary, Signed Decimal, Octal, Unsigned Decimal, or Hex (Hexadecimal) are the settings, with Hex being the default selection.
Set the number of bytes to display with Number of Bytes, Depends on Window Size or Fixed. Depends on Window Size selection is default.
Display a string representation of memory with Miscellaneous, Bytes Per Row or Display ASCII selections. Control Char displays non-ASCII characters; the default control character is the period (.).
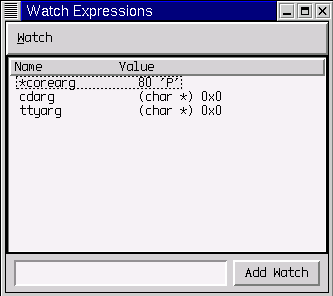
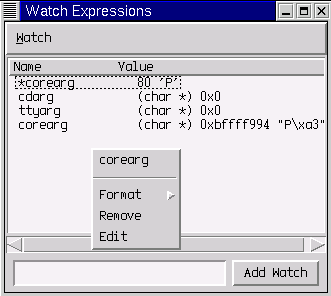
The Watch Expressions window displays the name and current value of user-specified expressions (Watch Expressions window).
The Watch Expressions window has the following functionality.
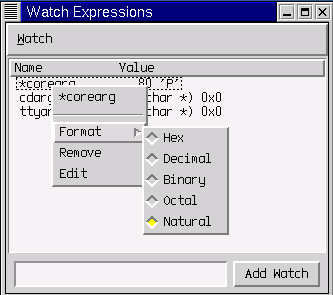
Right click in the display pane, having selected an expression, to invoke an expression-specific Watch menu (Watch menu in the Watch Expressions window).
Watch menu in the Watch Expressions window
Use Watch -> Edit to edit the value in an expression (an example of an expression capable of being edited is shown in Editing the value in an expression). Use the Esc key to abort editing.
Editing the value in an expression
Use Watch -> Format to invoke another pop-up menu for displaying a selected expression's value in Hex (Hexadecimal), Decimal, Binary, or Octal formats; by default, pointers display in hexadecimal with all other expressions as decimal. Use Watch -> Remove to remove a selected expression from the watch list.
Use the text edit field and the Add Watch button at the bottom of the window to add registers to the Watch Expression window or, by typing register convenience variables into the text edit field, add an expression to the watch list (see corearg added in Using the Add Watch button for the Watch Expressions window with its results in Results of using Add Watch button for the Watch Expressions window).
Using the Add Watch button for the Watch Expressions window
Every register has a corresponding convenience variable. The register convenience variables consist of a dollar sign followed by the register name; $pc is the program counter's convenience variable, for example, while $fp is the frame pointer's convenience variable.
Re-cast other types to which a pointer was cast by typing it in the text edit field. For example, typing (struct _foo *) bar in the text edit field, the bar pointer is cast as a struct _foo pointer.
Invalid expressions are ignored.
Results of using Add Watch button for the Watch Expressions window
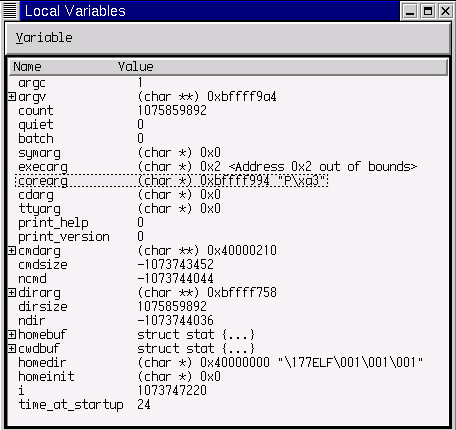
The Local Variables window displays the current value of all local variables.
Use Variable -> Edit to change the value of a selected variable that you want edit. Using the Escape key (Esc) aborts editing. Use Variable -> Format to invoke another pop-up menu to display a selected variable's value in Hex (Hexadecimal), Decimal, Binary or Octal formats. By default, pointers display in hexadecimal and all other expressions as decimal. Single click the mouse with the cursor over a variable in the Local Variables window to select the variable (Selecting a variable).
Double click the mouse with the cursor in the Local Variables window to edit the variable (Editing local variables).
Single click the mouse with the cursor on the plus sign to the left of a structure variable to see the elements of that structure (compare the variable structure for homebuf in Selecting a variable with the results in Displaying the elements of a variable structure). To close the structure elements, click the minus sign to the left of an open structure (compare the variable structure in Displaying the elements of a variable structure with what the window had displayed in Selecting a variable).
Displaying the elements of a variable structure
See also Setting Breakpoints and Viewing Local Variables and File after changing local variables values..
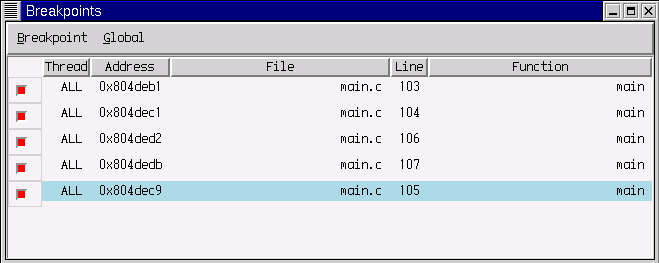
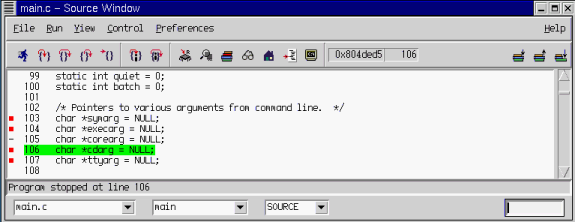
The Breakpoints window displays the currently set breakpoints. See Breakpoints window for the main.c example program breakpoints running in the Source Window, and see Results of setting breakpoints at line 105 for the results in the Source Window.
Breakpoints and exceptions may not work, especially if debugging C++ code, and the Breakpoints window may be inoperative.
Single click the mouse with the cursor over a check-box for a breakpoint to select that breakpoint (see the breakpoint results for line 105 in Selecting a breakpoint).
Single click with the mouse with the cursor over a check-box of a breakpoint to disable the breakpoint. The color of the square in the Breakpoint window changes (Line 101 in Setting temporary breakpoints in the Breakpoints window) and the line's breakpoint status changes in the Source Window.
Setting temporary breakpoints in the Breakpoints window
Using the Breakpoint menu for the Breakpoints window, toggle the enabled or disabled state of a selected breakpoint. The single check mark between them shows the state of the selected breakpoint. Remove removes the selected breakpoint.
Using the Global menu for the Breakpoints window, Disable All disables all breakpoints, Enable All enables all breakpoints, and Remove All removes all breakpoints.
Single click an empty check box of a disabled breakpoint to re-enable a breakpoint (Results in Source Window having enabled a breakpoint). A check reappears and the color of the square in the Source Window changes (see line 105 in Results of setting breakpoints at line 105.).
Results in Source Window having enabled a breakpoint
Using the Breakpoint menu, toggle between the normal and temporary setting of a selected breakpoint. A normal breakpoint remains valid no matter how many times it is hit. A temporary breakpoint is removed automatically the first time it is hit. A single check mark for either setting shows the state of the selected breakpoint. When a breakpoint is set to temporary, the line in the Source Window no longer has a colored quare, as shown by comparing Results in Source Window having enabled a breakpoint with Results in Source Window having set a breakpoint as temporary, where the breakpoint for line 105 in the main.c example program changed.
Results in Source Window having set a breakpoint as temporary
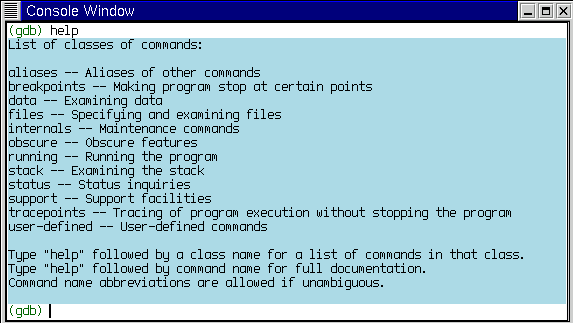
To send commands directly to the GDB interpreter, use the Console window (Console window).
The Console window opens with a (gdb) prompt for invoking debugging commands. Console window shows the help command's available topics when using the Console window. For more specific commands, see Debugging with GDB in GNUPro Debugger Tools.
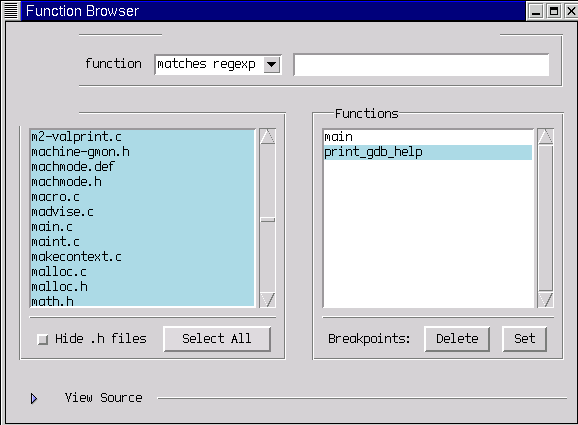
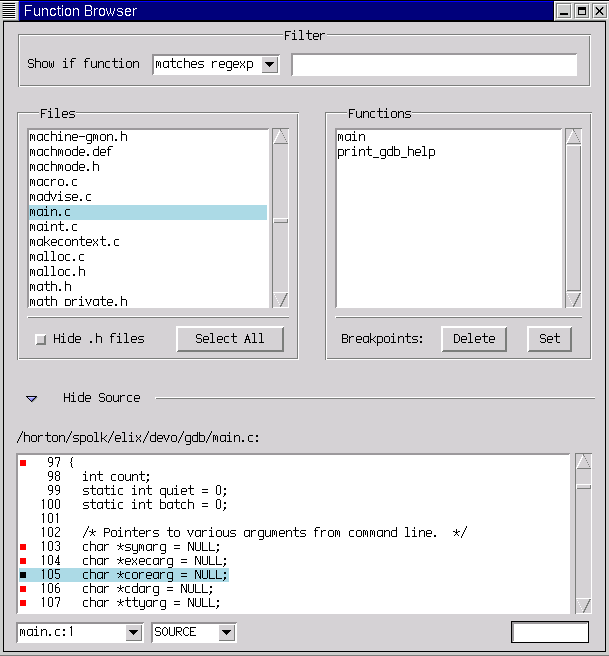
To invoke the Function Browser window, select View -> Function Browser from the Source Window. The Function Browser window has several fields that provide search and browsing capability for source code debugging (Function Browser window). Descriptions follow of the Filter, Files, Functions and View Source fields.
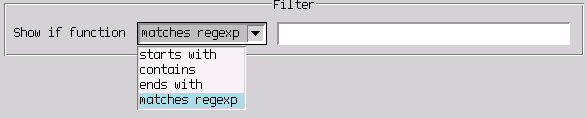
The Filter group at the top of the Function Browser window contains the Show if function drop-down list box and a text edit field. Show if function allows you to match the character string in the text edit field to its right by any of the four alternatives. Using the Show if function drop-down list box (Show if function drop-down list box), starts with shows functions that start with the character string in the text edit field entry, contains shows functions that contain the character string in the text edit field entry, ends with shows functions that end with the character string in the text edit field entry, matches regexp makes the search routines use regular expression matching (for example, searching for "^[ab].*" matches all functions starting with either a or b letters).
Show if function drop-down list box
The Files group limits the search to highlighted files. Clicking individual file names selects or deselects that file. The list of matching files refreshes when any search parameter changes. Hide .h files, if checked, disallows .h header files to display. Select All selects all listed files.
The Functions group matches all functions in the selected file(s). Breakpoints has two available buttons, Delete or Set; Delete removes a breakpoint previously set at the first executable line of the selected function, while Set sets a breakpoint at the first executable line of the selected function. Both of these will work on any and all selected functions in the listing. If all functions are selected, they all get or lose a breakpoint.
View Source/Hide Source allows you to toggle between displaying or hiding a file in a source browser (Function Browser window with source browser); the source browser has the same functionality as when using the Source Window.
Function Browser window with source browser
There are four display and selection fields below the horizontal scroll bar (the same functionality as using the Source Window): the status text box (Status text box), the function drop-down combo box (Function drop-down combo box) and the code display drop-down list box (Code display drop-down list box); see the figures and their accompanying explanations for specific information.
The Processes window (Process window for displaying state of threads) dynamically displays the state of currently running threads.
Threads support is not available for all targets.
Processes window for displaying state of threads
The Processes window will display a list of threads and/or processes of an executable that you are debugging. The exact contents are specific to each operating system. The first column is the thread number, used internally by the debugger to track the thread. This number is also used by the command line interface (in the Console window) when referring to threads. The rest of the columns are dependent on information coming from the operating system.
The Source Window displays the current location and source for a current thread (or process). To change the current thread, click on the desired thread in the Threads window and the debugger will switch contexts, updating all windows. The current thread will highlight.
Having set a breakpoint on a line or function, stop execution and return control to the debugger for every thread that hits a set location. To set a breakpoint on a specific thread or threads, use the Source Window. See also Setting Breakpoints and Viewing Local Variables and Setting Breakpoints on Multiple Threads.
Invoke the window (Help window showing the help topic's index) using the Help menu from the Source Window to get HTML-based navigable help by topic.
Help window showing the help topic's index
The Help window has two menus: File and Topics.
The File menu makes the following options functional: Back moves back one HTML help page, relative to previous forward page movements; Forward moves forward one HTML help page, relative to previous back page movement; Home returns to the main HTML help "Table of Contents" page; Close closes the Help window.
The Topics menu displays information for each menu item. Content changes in the Help window to represent a selected topic.
The first menu item, index, returns to the main Help window (Help window showing the help topic's index).
The second item, Attach Dialog, is only for a host system's use, when attaching to another debugging process, and not for use by embedded targets.
The remaining menus document the Insight windows: Stack (Stack window), Registers (Registers window), Memory (Memory window), Watch Expressions (Watch Expressions window), Local Variables (Local Variable window), Breakpoints (Breakpoints window), Console (Console window), Function Browser (Function Browser window), and Processes (Process window for displaying state of threads).
The following documentation contains an example debugging session procedures for using Insight. See also Debug an Executable Application on a Target Board.
To select a source file, or to specify what to display when examining a source file when debugging, use the following process.
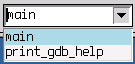
Select a function from the function drop-down list to the right of the file drop-down list, or type its name in the text field above the list to locate a function (in Searching for a word in source code, see the executable line 86, where the main function displays).
A breakpoint can be set at any executable line in a source file. Executable lines are marked by a minus sign in the left margin of the Source Window. When the cursor is in the left column and it is over an executable line, it changes into a circle. When the cursor is in this state, a breakpoint can be set.
The following exercise steps you through setting four breakpoints in a function, as well as running the program and viewing the changing values in the local variables.
Disabling a breakpoint in Breakpoints window
Re-enable the breakpoint at the line by clicking the check box in the Breakpoints window.
With Insight processing in a multi-thread environment, select threads and set breakpoints on one or more threads when debugging.
Multiple thread functionality does not work similarly on all embedded targets. When debugging C++ code, for instance, breakpoints and exceptions may not work on multiple threads.
A process can have multiple threads running concurrently, each performing a different task, such as waiting for events or something time-consuming that a program doesn't need to complete before resuming. When a thread finishes its job, the debugger suspends or destroys the thread running in the debugging process.
The thread debugging facility allows you to observe all threads while your program runs. However, whenever the debugging process is active, one thread in particular is always the focus of debugging. This thread is called the current thread.
The precise semantics of threads and the use of threads differs depending on operating systems.
In general, the threads of a single program are like multiple processes--except that they share one address space (that is, they can all examine and modify the same variables). Additionally, each thread has its own registers and execution stack, and perhaps private memory.
Breakpoint pop-up menu in the Source Window