Using Control Center
To begin using Confluent Control Center, open your web browser and connect to the server running Control Center at
the port where the server is running. For example, if you are running the software on a host called controlcenter
and using the default port (9021), you would open the URL http://controlcenter:9021.
For details on how to change the port used by Control Center, see Configuring Control Center.
Overview of the app
When you first open Control Center, you will see a set of charts that are showing you how your pipelines are running, and a menu allowing you to choose between different functions of Control Center.
On the right hand side of the screen, you will see Data Stream Monitoring mode. See Data Stream Monitoring for more information on using Data Stream Monitoring .
On the left hand side of the screen are two buttons, allowing you to choose between Data Stream Monitoring mode and Kafka Connect configuration mode. See Kafka Connect Configuration for more information about using Kafka Connect configuration.
Data Stream Monitoring
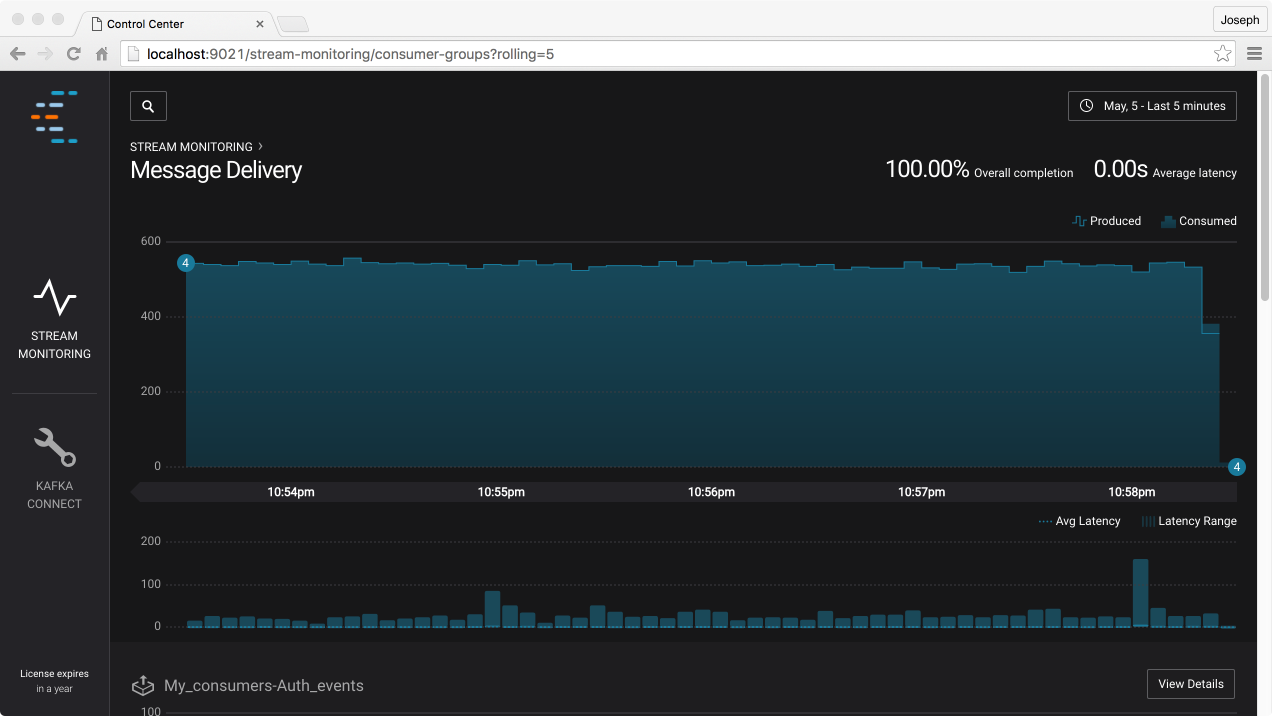
Data Stream Monitoring will show you how many messages were produced and consumed over time and highlight any differences between messages produced and consumed. It will also show you how long it takes messages to make it from producers to consumers. To help identify problems, you can focus on specific consumer groups, and change the time range or time period being shown.
Understanding the line charts
To help understand delivery, we provide two different charts. The first chart shows metrics on the number of messages delivered. The second chart shows metrics on timing.
The delivery chart is on top (and taller), and the timing chart is underneath (and shorter). Both charts will show the same time range. By holding a mouse over either chart, the user interface will show a set of lines on other charts making it easy to compare activity during the same time bucket.
The times shown on the chart are based on the time at which messages were sent. More specifically, these are the timestamps included in Kafka messages. These timestamps are added at the time that messages are produced. By default, this time stamp will be generated by the Kafka Client when messages are sent, but an application may override these timestamps. For more information about the use of timestamps, see Concept Guide. Counts on the chart are shown for a “bucket” of timestamps, not a specific timestamp. If you zoom in to 10 minutes, the bucket will be 15 seconds wide (by default); these ranges will expand as you zoom out to maximize readability.
The delivery chart shows the number of expected messages as a line on top, and the number consumed as the area. (The number of expected messages is the number of messages produced on topics for which there are consumers.) A gap between the “produced” lines and the “consumed” area indicates that some messages that were produced have not yet been seen by the consumer. If they arrive late, Control Center will update the chart to show that more messages were received. Typically, there will be a gap between produced and consumed messages very soon after they are sent, and this gap will diminish over time. (It takes some time for messages to move through a pipeline to be processed.) If a gap persists over time, Control Center will highlight the gap in orange to help draw a user’s attention to it.
You may notice small circles on the far left and right of the delivery line chart. Clicking on the circle on the left will show you details on the topics that feed into the chart (where the data came from). Clicking on the circle on the right shows a list of consumer groups that are covered by this chart (where data flows to).
In some cases, the metrics data used by Control Center may be lost. If this occurs, we will indicate that there is missing audit data on the charts. See Missing Metrics Data for more details.
The latency chart shows the minimum latency, average latency, and maximum latency for messages sent within each time window. See Concept Guide for more details about how latency is calculated.
Changing the time range or time period
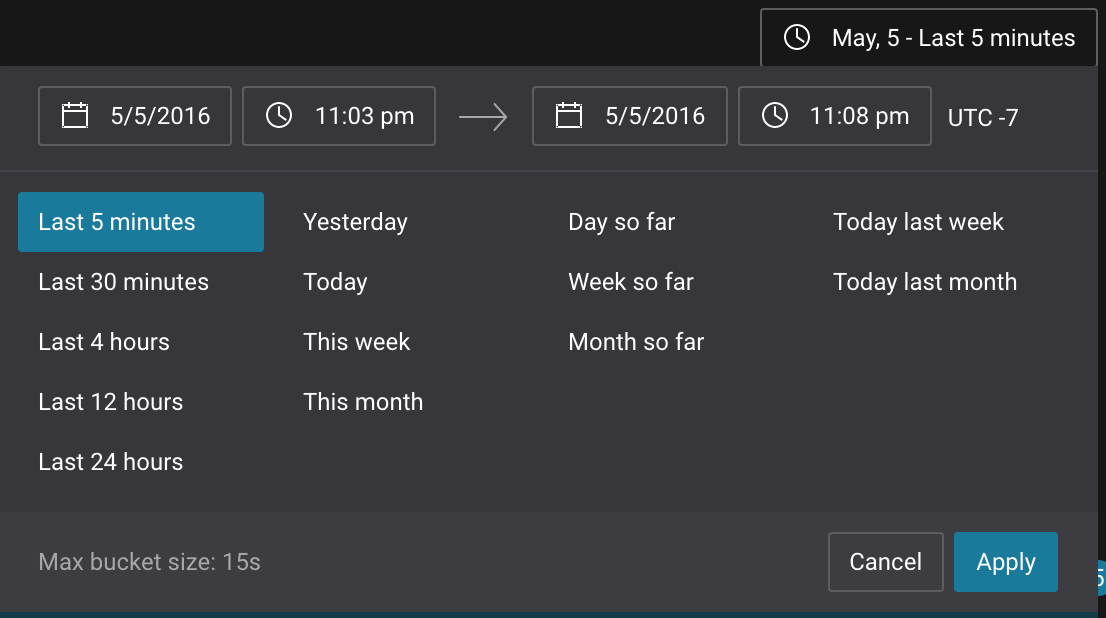
In the top right corner of the user interface, there is a clock icon with some information about a date (in this example, “May, 5 - Last 5 Minutes”). If you click this icon, a date selector (like Date Selector) will appear that allows you to see more details and change time properties.
At the top of the date selector, there are selectors that allow you to explicitly choose a beginning and ending time. But for convenience, we also include buttons that let you choose commonly used time periods, including the last 30 minutes, all data from today, and the week so far.
Confluent Control Center will automatically choose appropriate bucket sizes based on the time range that you select. The bucket size will be shown at the bottom of the select (in this example, “max bucket size 15 seconds”).
Getting details about consumer groups
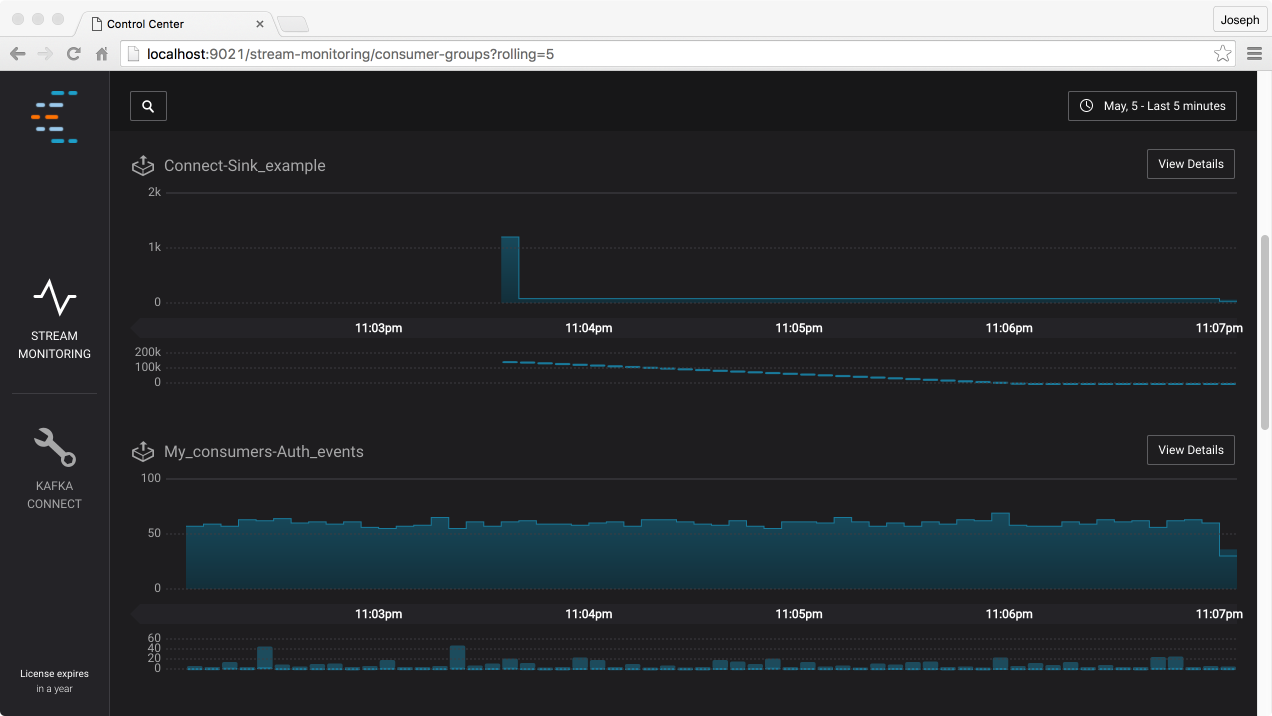
At the top of the screen, we show a summary across all consumer groups. But at the bottom of the screen, we show a series of smaller charts that provide details on specific consumer groups.
You may notice numbered circles on the charts; clicking on the left button shows you details on the consumers feeding into this chart.
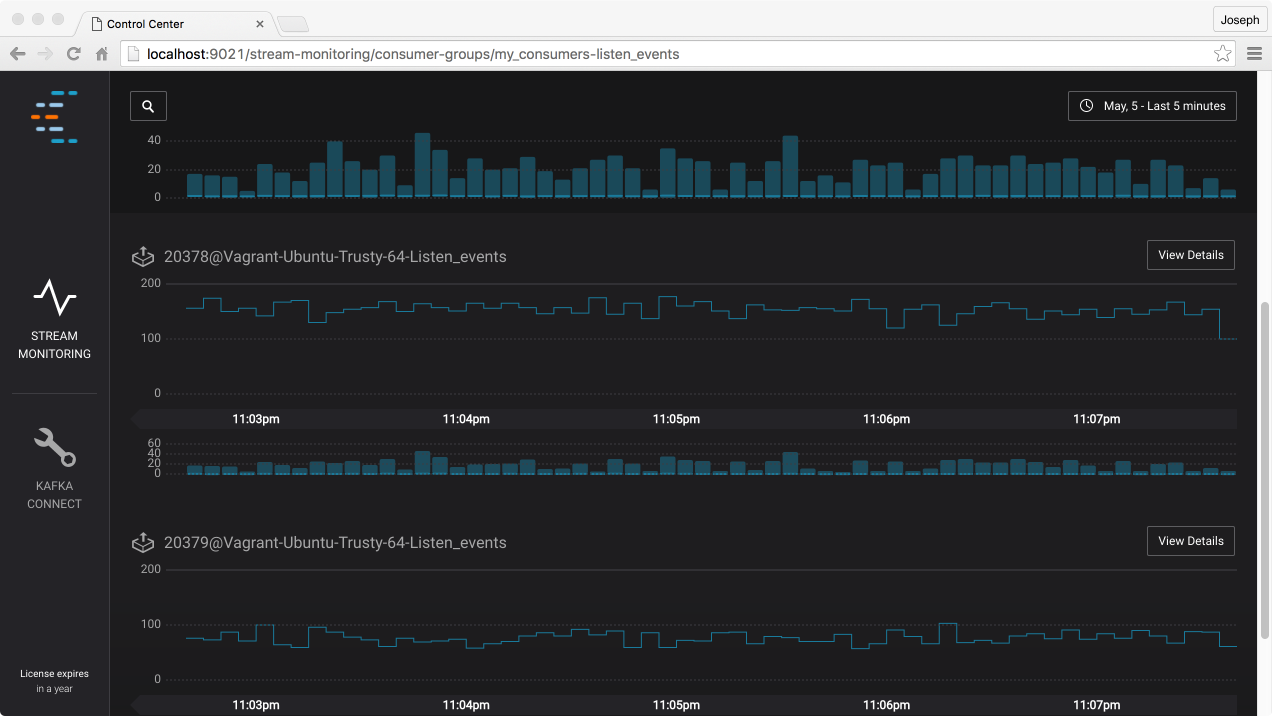
At the right of each consumer group, there is a button that says “View Details.” Clicking this button will let you drill down further and examine information about the number of messages consumed (and the time to consume these messages) for each consumer.
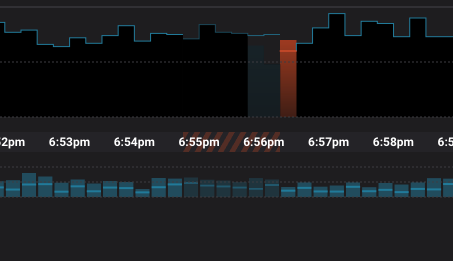
In rare cases, the metrics used for Data Stream Monitoring might be lost. As described in the Concept Guide, Data Stream Monitoring uses Kafka to send metrics data to the Control Center Application. These messages might be lost or delayed, for example due to an application failure. If this occurs, the Data Stream Monitoring application will detect that monitoring data was lost and display this. An example of this is shown in Closeup showing lost Data Stream Monitoring metrics.
Missing Metrics Data
We differentiate between lost or duplicate messages sent by your applications and lost or duplicate messages sent by the Confluent metrics interceptors by showing a herringbone pattern on the axis. An error like this means that we can’t tell if any of your application messages were lost, delayed, or duplicated. (It is possible that they were lost, and also possible that they were not.) If you see an error like this, we recommend investigating further.
Kafka Connect Configuration
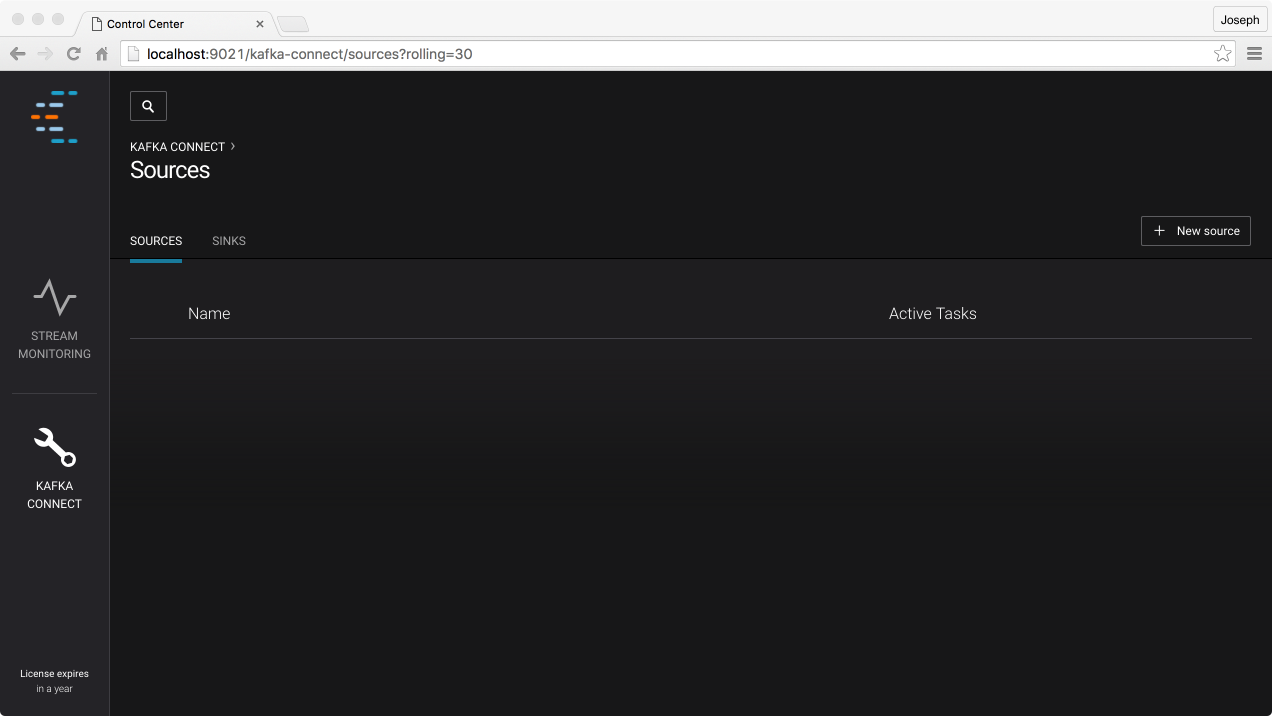
The Control Center interface also lets you configure Kafka Connect. Control Center uses the Kafka Connect API to get information on running connectors; if no connectors are running you may see an empty list when you first open the application.
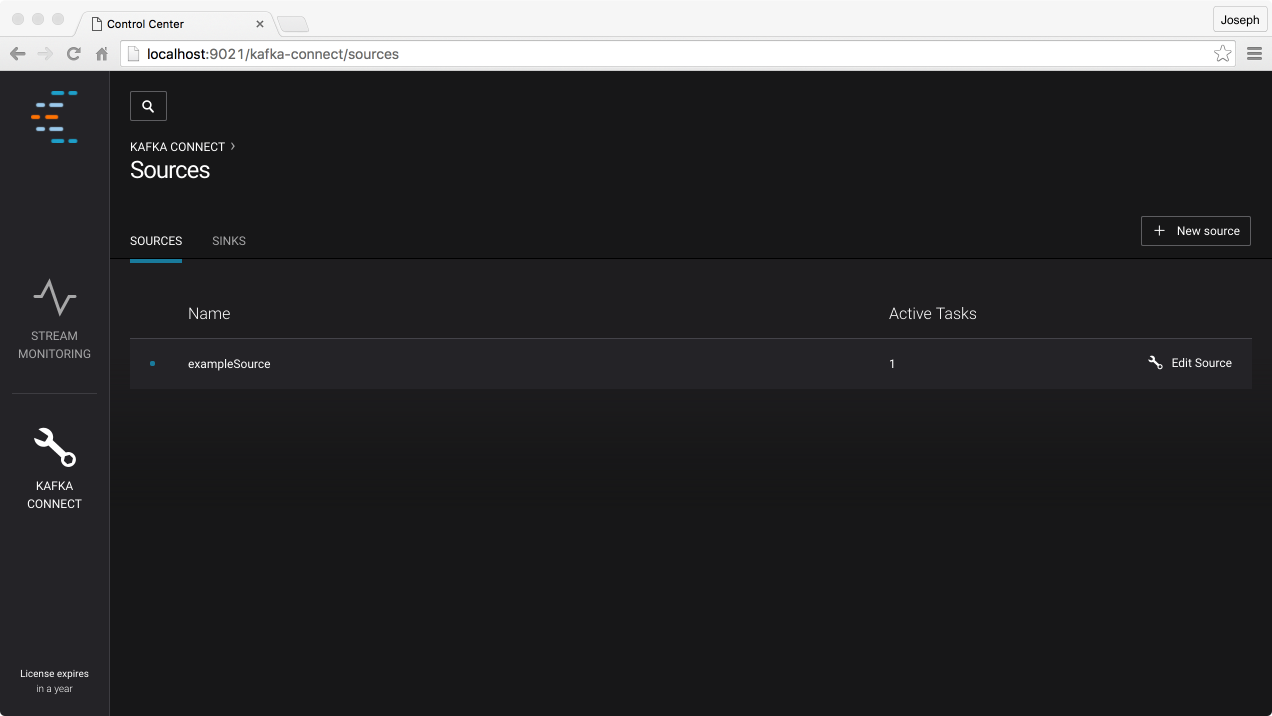
At the top of the application, there are links to tabs showing “sources” and “sinks.” You may select either tab to view active sources and sinks, or to create new sources and sinks. You may also select an existing source or sink from a list to edit settings for that connector.
Creating new Connectors
To create a new source, click the “+ New Source” button from the Sources tab, to create a new sink, click the “+ New Sink” button from the Sinks tab.
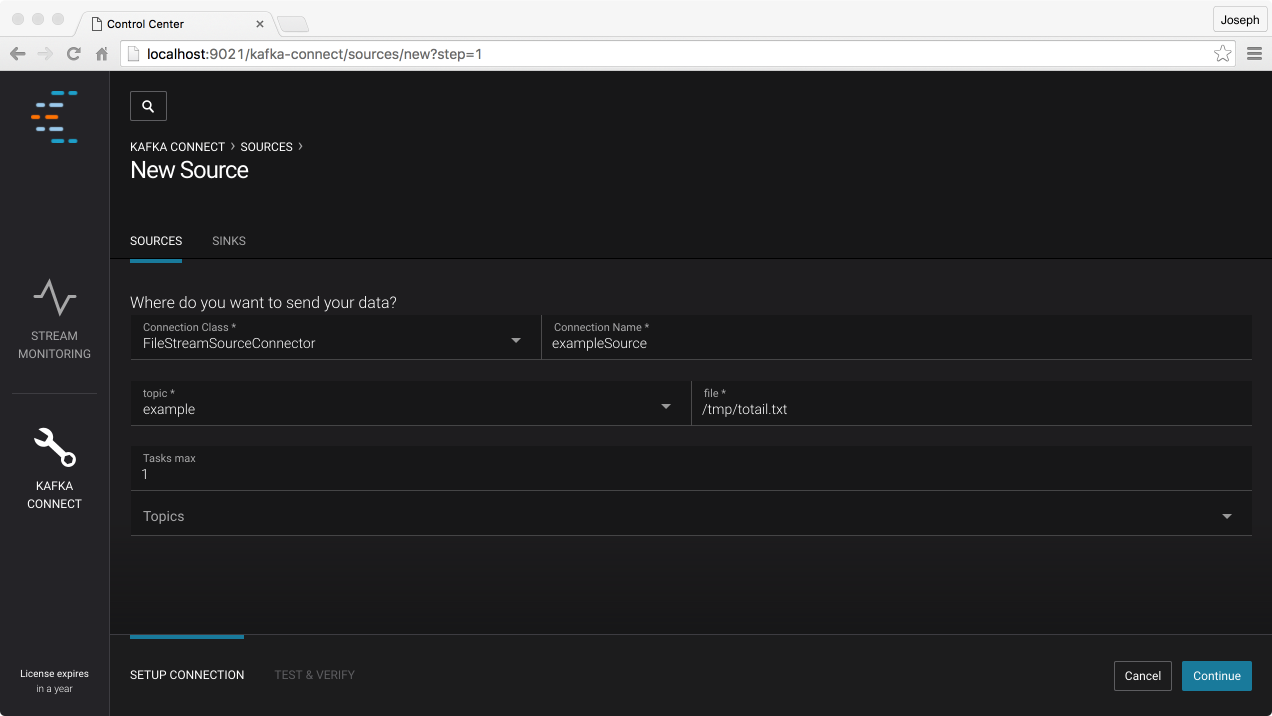
When you click the “+ New Source” button, you will see a form with settings for the connector. All sources require you to specify at least three settings:
- Connection Class
- This is the Java class name for the connector. In this example, we picked the FileStreamSourceConnector that ships with Apache Kafka.
- Connection Name
- This is a unique name for the connector. This is shown in the list of active sources and sinks. We recommend entering an intuitive, easy to understand name.
- Tasks max
- This controls the number of connector tasks that are created.
Most sources allow you to specify other settings. Typically these include information needed to connect to external systems, information about what data to include or exclude, and instructions on how to map external data to topics. In this example, you are required to specify a file name and a topic. Most sources require you to specify a topic (or describe a set of topics) to which messages are written.
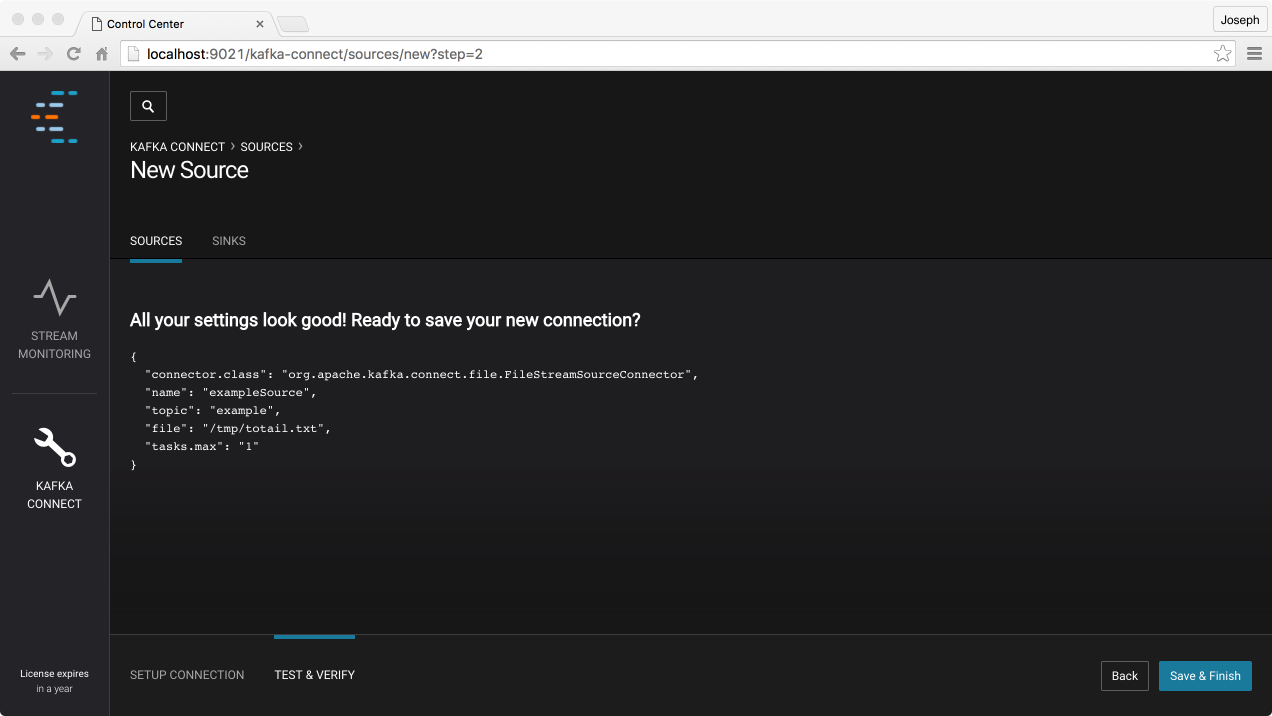
When you have entered all the required parameters and click “continue,” you will be shown a summary of the settings that you entered. (This is the information that will be sent to the Connect REST API.) If everything looks OK, you can click “Save and Finish;” if you would like to change anything, click “back” to return to the edit screen.
After you have saved the settings, the new source will appear in the list of sources. A colored indicator on the left will show the status of the source: blue indicates that the source is working, red indicates an error. On the right hand side of the line, there is a wrench icon next to the words “Edit Source.” You can click this icon to edit or remove an existing source.
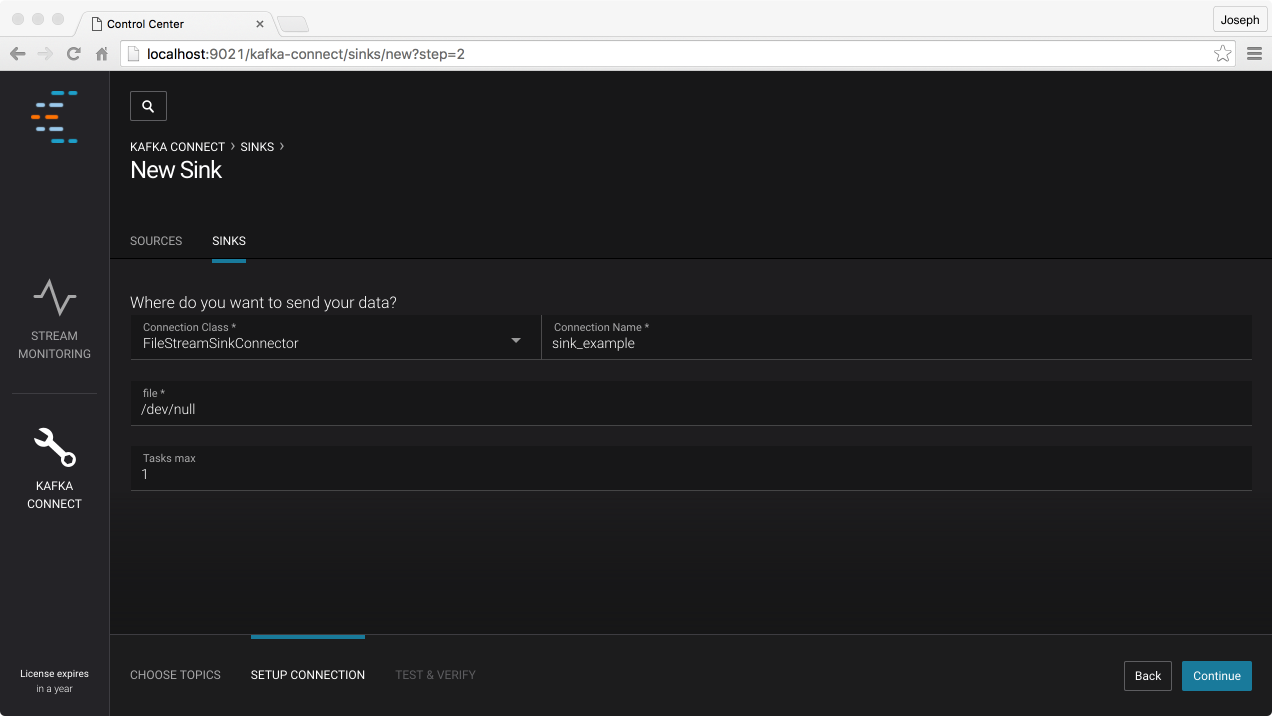
Similarly, you can use the user interface to create new sinks. When you create a sink, you will first be prompted to enter a set of topics that you would like to feed to the sink. After you have entered the topics, you will see a screen that prompts you for more information.
Similar to sources, you are required to select a connection class, name the connection, and pick the maximum number of tasks. In most cases, you will also be asked to configure other settings to connect to external systems, filter data, or otherwise control the behavior of the sink. Confirmation works the same way with sinks as it does with sources. Additionally, the list of sinks behaves the same way: a colored indicator shows status, and you click the “Edit Sink” link to edit the connector.
Editing Sources and Sinks
To edit a source or sink, click the “Edit Source” or “Edit Sink” button shown in the list. You can edit almost all parameters for a source or sink except for the name and connector class.

