Kafka Client Guide
To use Stream Monitoring, you need to install the Confluent Monitoring Interceptors with your applications, and configure your applications to use the interceptor to send metrics to Control Center. This guide explains how to do this.
Interceptor Installation
With Kafka 0.10.0.0+, Kafka Clients support pluggable interceptors to examine (and potentially modify) messages. Confluent Control Center uses an interceptor that collects statistics on incoming and outgoing messages to provide Stream Monitoring.
To use Confluent Control Center’s Stream Monitoring feature, first you need to install the Confluent Metric Interceptor on client machines. Detailed instructions for getting Confluent Platform clients are provided at Installation.
We recommend using a build tool like Maven, Ivy, or Gradle when developing Java applications. Here is some sample content for a POM file for maven. First, you need to specify the Confluent maven repository:
<repositories>
  ...
  <repository>
    <id>confluent</id>
    <url>http://packages.confluent.io/maven/</url>
  </repository>
  ...
</repositories>
Next, you can add dependencies. To monitor a producer or consumer with Control Center, you need to include the dependencies for the Apache Kafka Java clients and the Confluent Monitoring Interceptor:
<dependencies>
  ...
    <dependency>
        <groupId>org.apache.kafka</groupId>
        <artifactId>kafka-clients</artifactId>
        <version>0.10.1.0-cp2</version>
    </dependency>
    <dependency>
        <groupId>io.confluent</groupId>
        <artifactId>monitoring-interceptors</artifactId>
        <version>3.1.1</version>
    </dependency>
  ...
 <dependencies>
Application Configuration
After you have configured your applications to include the Confluent Monitoring Interceptor, you must configure your clients to use the interceptor.
Adding the interceptor to your Kafka Producer
If you are not using any interceptors currently, you will need to add a new item to the Java Properties object that
you use to create a new Producer. Specifically, you need to set interceptor.classes to
io.confluent.monitoring.clients.interceptor.MonitoringProducerInterceptor. If you are already using an interceptor,
then you need to add an additional item to interceptor.classes.
Adding the interceptor to your Kafka Consumer
If you are not using any interceptors currently, you will need to add a new item to the Java Properties object that
you use to create a new Consumer. Specifically, you need to set interceptor.classes to
io.confluent.monitoring.clients.interceptor.MonitoringConsumerInterceptor. If you are already using an interceptor,
then you need to add an additional item to interceptor.classes.
Warning
The producer and consumer interceptor classes are different; make sure you choose the correct class for each producer and consumer.
Adding interceptors to your Kafka Streams application
For Kafka producers and consumers used internally, you can specify the Confluent Monitoring Interceptor to be used. For producers, you need to set producer.interceptor.classes to
io.confluent.monitoring.clients.interceptor.MonitoringProducerInterceptor. For consumers, you will need to set consumer.interceptor.classes io.confluent.monitoring.clients.interceptor.MonitoringConsumerInterceptor.
Interceptor Configuration
We provide some configuration parameters that allow you to configure the Confluent Control Center interceptors.
By default, interceptors will send and receive messages using the same Kafka cluster that you are monitoring, and will use a set of default topics to share information. The interceptors will also report data at a regular interval of, by default, 15 seconds.
Logging
Both the Apache Kafka client and the Confluent interceptor use slf4j for logging errors and other information.
To enable logging, you need to configure an slf4j binding, or you will see an error message like “Failed to load class
org.slf4j.impl.StaticLoggerBinder.” The simplest way to resolve this issue is to add slf4j-simple.jar to your
classpath. For more details, see http://www.slf4j.org/codes.html#StaticLoggerBinder.
Configuration options
We allow you to change the behavior of the interceptors. (In most applications, we recommend keeping the default.)
You can change any Kafka producer configuration option for the interceptor by prefixing it with
confluent.monitoring.interceptor. (including the . on the end). For example, you can change the value of
timeout.ms for the interceptor using the property confluent.monitoring.interceptor.timeout.ms.
For more information on Kafka producer options, see the
Apache Kafka Producer documentation.
There are also some configuration parameters that are only used by the interceptor:
confluent.monitoring.interceptor.topic- Topic on which monitoring data will be written. (Default is
_confluent-monitoring.) confluent.monitoring.interceptor.publishMs- Period the interceptor should use to publish messages to. (Default is 15 seconds.)
confluent.monitoring.interceptor.client.id- A logical client name to be included in Confluent Control Center monitoring data. If not specified, client id of an
intercepted client with
confluent.monitoring.interceptoris used.
Example Configuration
Below shows how to setup stream monitoring for the built-in performance testing tools that come with Kafka. The instructions assume you have a cluster setup similar to that of the Quickstart guide.
With Control Center already running, open a terminal and run the following commands to start the Producer Performance Test tool with the
MonitoringProducerInterceptor$ export CLASSPATH=./share/java/monitoring-interceptors/monitoring-interceptors-3.1.1.jar $ ./bin/kafka-producer-perf-test --topic c3test --num-records 10000000 --record-size 1000 \ --throughput 10000 --producer-props bootstrap.servers=localhost:9092 \ interceptor.classes=io.confluent.monitoring.clients.interceptor.MonitoringProducerInterceptor acks=all
In a separate terminal, start up the console consumer with the
MonitoringConsumerInterceptor$ export CLASSPATH=./share/java/monitoring-interceptors/monitoring-interceptors-3.1.1.jar $ echo "interceptor.classes=io.confluent.monitoring.clients.interceptor.MonitoringConsumerInterceptor" > /tmp/consumer.config $ echo "group.id=c3_example_consumer_group" >> /tmp/consumer.config $ bin/kafka-console-consumer --topic c3test --new-consumer --bootstrap-server localhost:9092 --consumer.config /tmp/consumer.config
Open up the Control Center UI at http://localhost:9021/ and click on
Stream Monitoringto view the stream monitoring UI for thec3_example_consumer_group.
Multi Cluster Configuration
Stream Monitoring can be used to view data from multiple Kafka Clusters - all metric data from the interceptors is tagged by Kafka cluster id and aggregated in Control Center by cluster id.
There are two general strategies for configuring interceptors: mirrored and direct.
Mirrored
By default interceptors send metric data to the same Kafka cluster they are monitoring. You can use MirrorMaker or Confluent Replicator to transfer and merge this data into the Kafka Cluster used by Control Center.
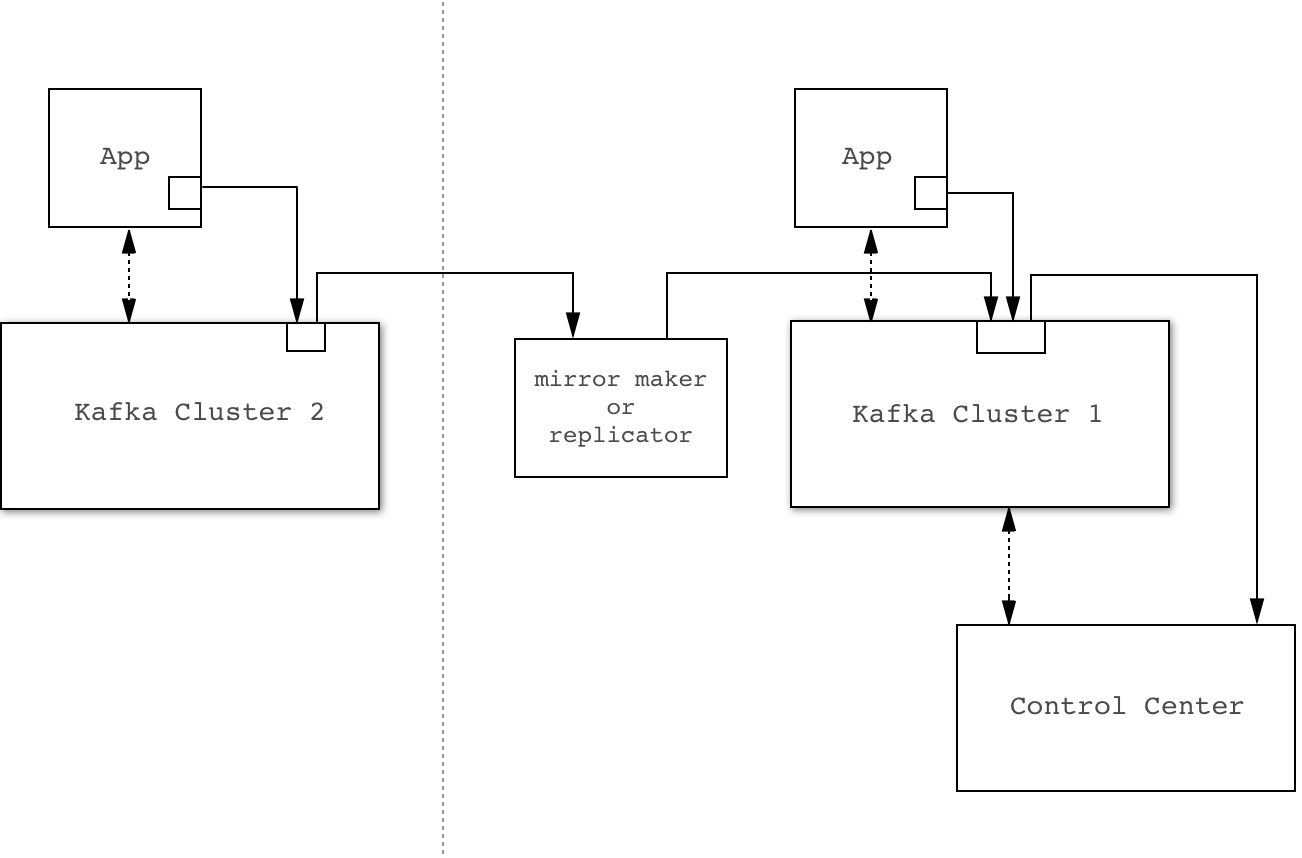
Example mirrored configuration. Solid lines indicate flow of interceptor data.
The primary advantage of this approach is ease of configuration - It does not require separate configuration (including security parameters) for the interceptors and the application. It also simplifies any network-based access controls between clusters as all data flows between clusters using a single agent
Potential disadvantages of this approach are:
- If you are not already using MirrorMaker or Confluent Replicator, this adds another component to your system to manage.
- Availability problems in the Kafka cluster being monitored will affect delivery of interceptor metric data.
Direct
You can configure interceptors to send metric data directly to Control Center’s Kafka Cluster (which in general may be different from the cluster that the Kafka Client being monitored is connected to).
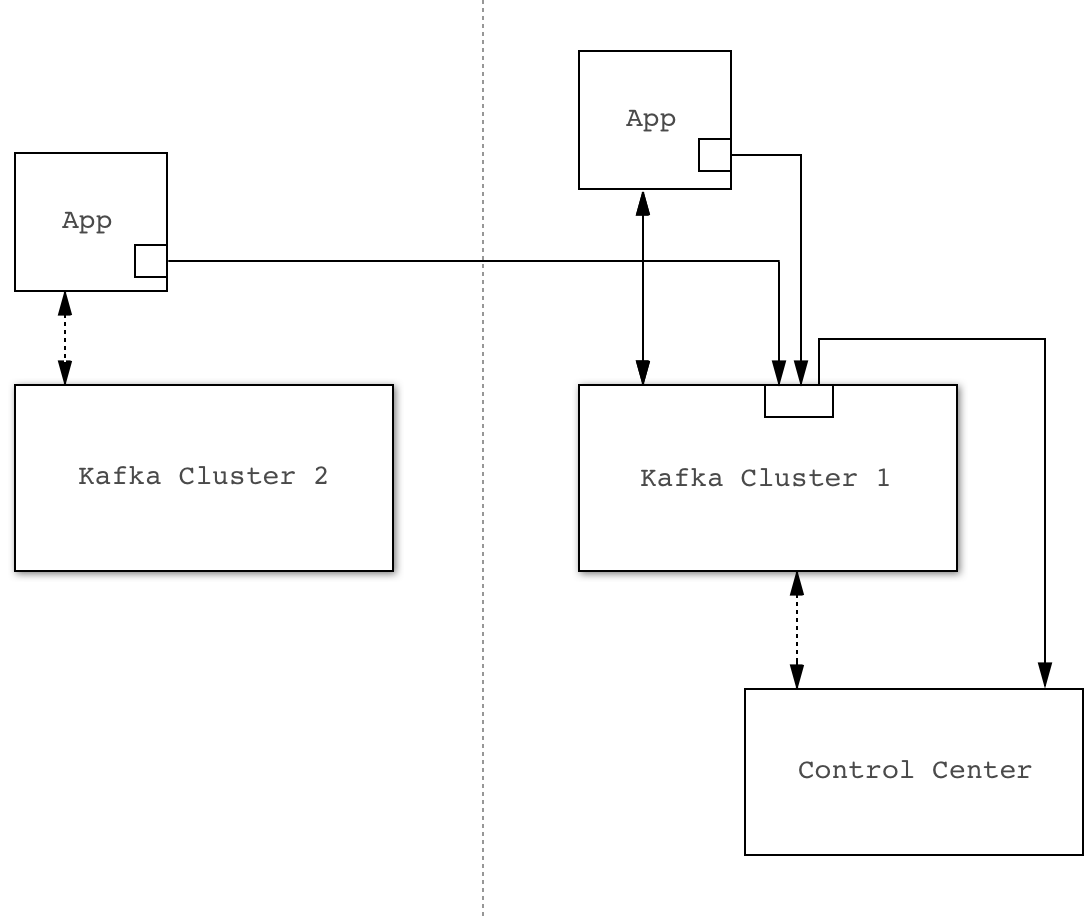
Example direct configuration. Solid lines indicate flow of interceptor data.
The primary advantage of this approach is that it is robust against availability issues with the cluster being monitored.
The primary disadvantage is that every Kafka Client needs to be configured with the Control Center Kafka cluster connection parameters. This could potentially be more time-consuming, particularly when security is enabled.
Dedicated Metric Data Cluster
You can use an existing Kafka cluster as the ultimate destination for interceptor data and for Control Center internal requirements, or you can configure a dedicated cluster for this purpose.
The primary disadvantage of using a dedicated cluster is that requires additional setup and maintenance.
However, there are a couple of advantages:
- Ease of upgrade. Future versions of Control Center are likely to take advantage of new features of Kafka. If you use a separate Kafka cluster for Control Center, it may be logistically easier for you to take advantage of new features in future versions of Control Center.
- This cluster may have reduced security requirements that could make it easier to implement the direct strategy described above.