Concept Guide
This part of the documentation provides a high level overview of how data stream monitoring works. For more about Kafka Connect, see Kafka Connect.
Motivation
Suppose that you are using Kafka to help transport data messages from a set of producers to a set of consumers. Further, let’s assume that the producers and consumers are in different data centers, and you are using Mirrormaker to copy data from one cluster to another. So, you would have a setup that looked something like this:
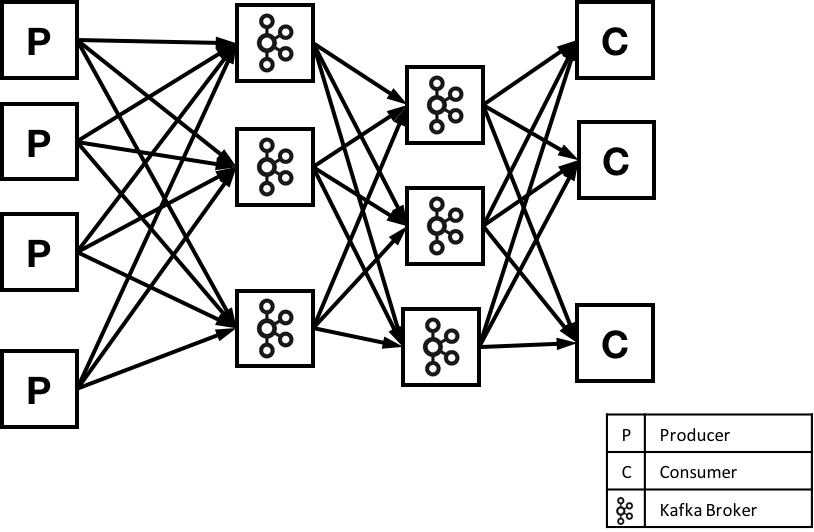
An example system using Kafka
If you are building a critical application, you probably need to detect any issues moving data: late messages, duplicate messages, or lost messages. Reliably detecting these issues in a distributed system is a hard problem. We built Stream Monitoring to make this easier.
Control Center has three different parts: metrics interceptors that collect metric data on clients (producers and consumers), Apache Kafka to move metric data, and the Control Center application server for analyzing stream metrics. By adding lightweight code to clients, Stream Monitoring can count every message sent and received in a streaming application. By using Kafka to send metrics information, Stream Monitoring metrics are transmitted quickly and reliably to the Control Center application.
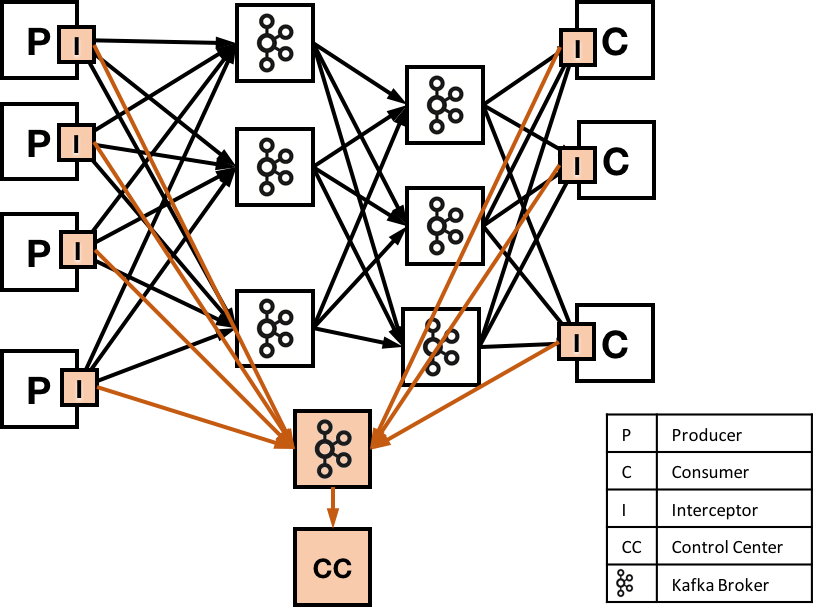
An example system using Kafka, monitored by control center
Time windows and metrics
Stream Monitoring is designed to efficiently audit the set of messages that are sent and received. To do this, we use a set of techniques to measure and verify delivery.
The interceptors work by collecting metrics on messages produced (or consumed) on each client, and sending these to
Confluent Control Center for analysis and reporting. Both interceptors use Kafka message timestamps to group messages.
Specifically, the interceptors will collect metrics during a 15 second time window based on this timestamp. (You can
calculate this by a function like floor(messageTimestamp / 15) * 15.) Metrics are collected for each combination
of producer, consumer group, consumer, topic, and partition. Currently, metrics include a message count and cumulative
checksum for producers and consumer, as well as latency information from consumers. We may add additional measurements
in the future.
Latency
Latency is measured by calculating the difference between the system clock time on the consumer and the timestamp in the message. In a distributed environment, it can be difficult to keep clocks synchronized. If the clock on the consumer is running faster than the clock on the producer, then Control Center might show latency values that are higher than the true values. If the clock on the consumer is running slower than the clock on the producer, then Control Center might show latency values that are lower than the true values (and in the worst case, negative values).
If your clocks are out of sync, you might notice some unexpected results in Confluent Control Center. We recommend using a mechanism like NTP to synchronize time between production machines; this can help you keep clocks synchronized to within 20ms over the public internet, and to within 1 ms for servers on the same local network.
Tip
NTP practical example: In an environment where messages take 1 second or more to be produced and consumed, and NTP is used to synchronize clocks between machines, the latency information should be accurate to within 2%.