System Health
System Health provides insight into the well-being of the cluster from both a broker and topic-centric perspective. The two sections share many common features with each other, which will be outlined below.
Navigation
System Health is accessible by selecting the item labeled “System Health” from the main navigation.
The main ways to adjust the data you’re seeing are as follows:
- Using the sub navigation menu to jump between broker and topic views:

- Clicking the KPI menu items on the left hand side of the page to see more detailed information:
- Using the table view selector to choose between raw, trend and bullet chart views:
- Selecting “View details” from the ”...” contextual menu on each row of the topics table which navigates to Topic Management:

- Selecting a percentile from the request latency percentile dropdown (broker view only):
Note
Request latency percentiles are only available in the brokers section of System Health.
UI Commonalities
- Chart Tooltips
- Each chart displays a similarly styled tooltip when hovering. These tooltips can display multiple metrics at the same time which are each paired with an icon. The icon will either be a (good) check mark or a (bad) X symbol at each point.
- Table Metric Validations
- Similar to the chart tooltips, many of the table metrics will visually change to indiciate potential issues via a red underline. Hovering the mouse over text with a red underline will display an explanatory tooltip.
Produced and Fetched Charts
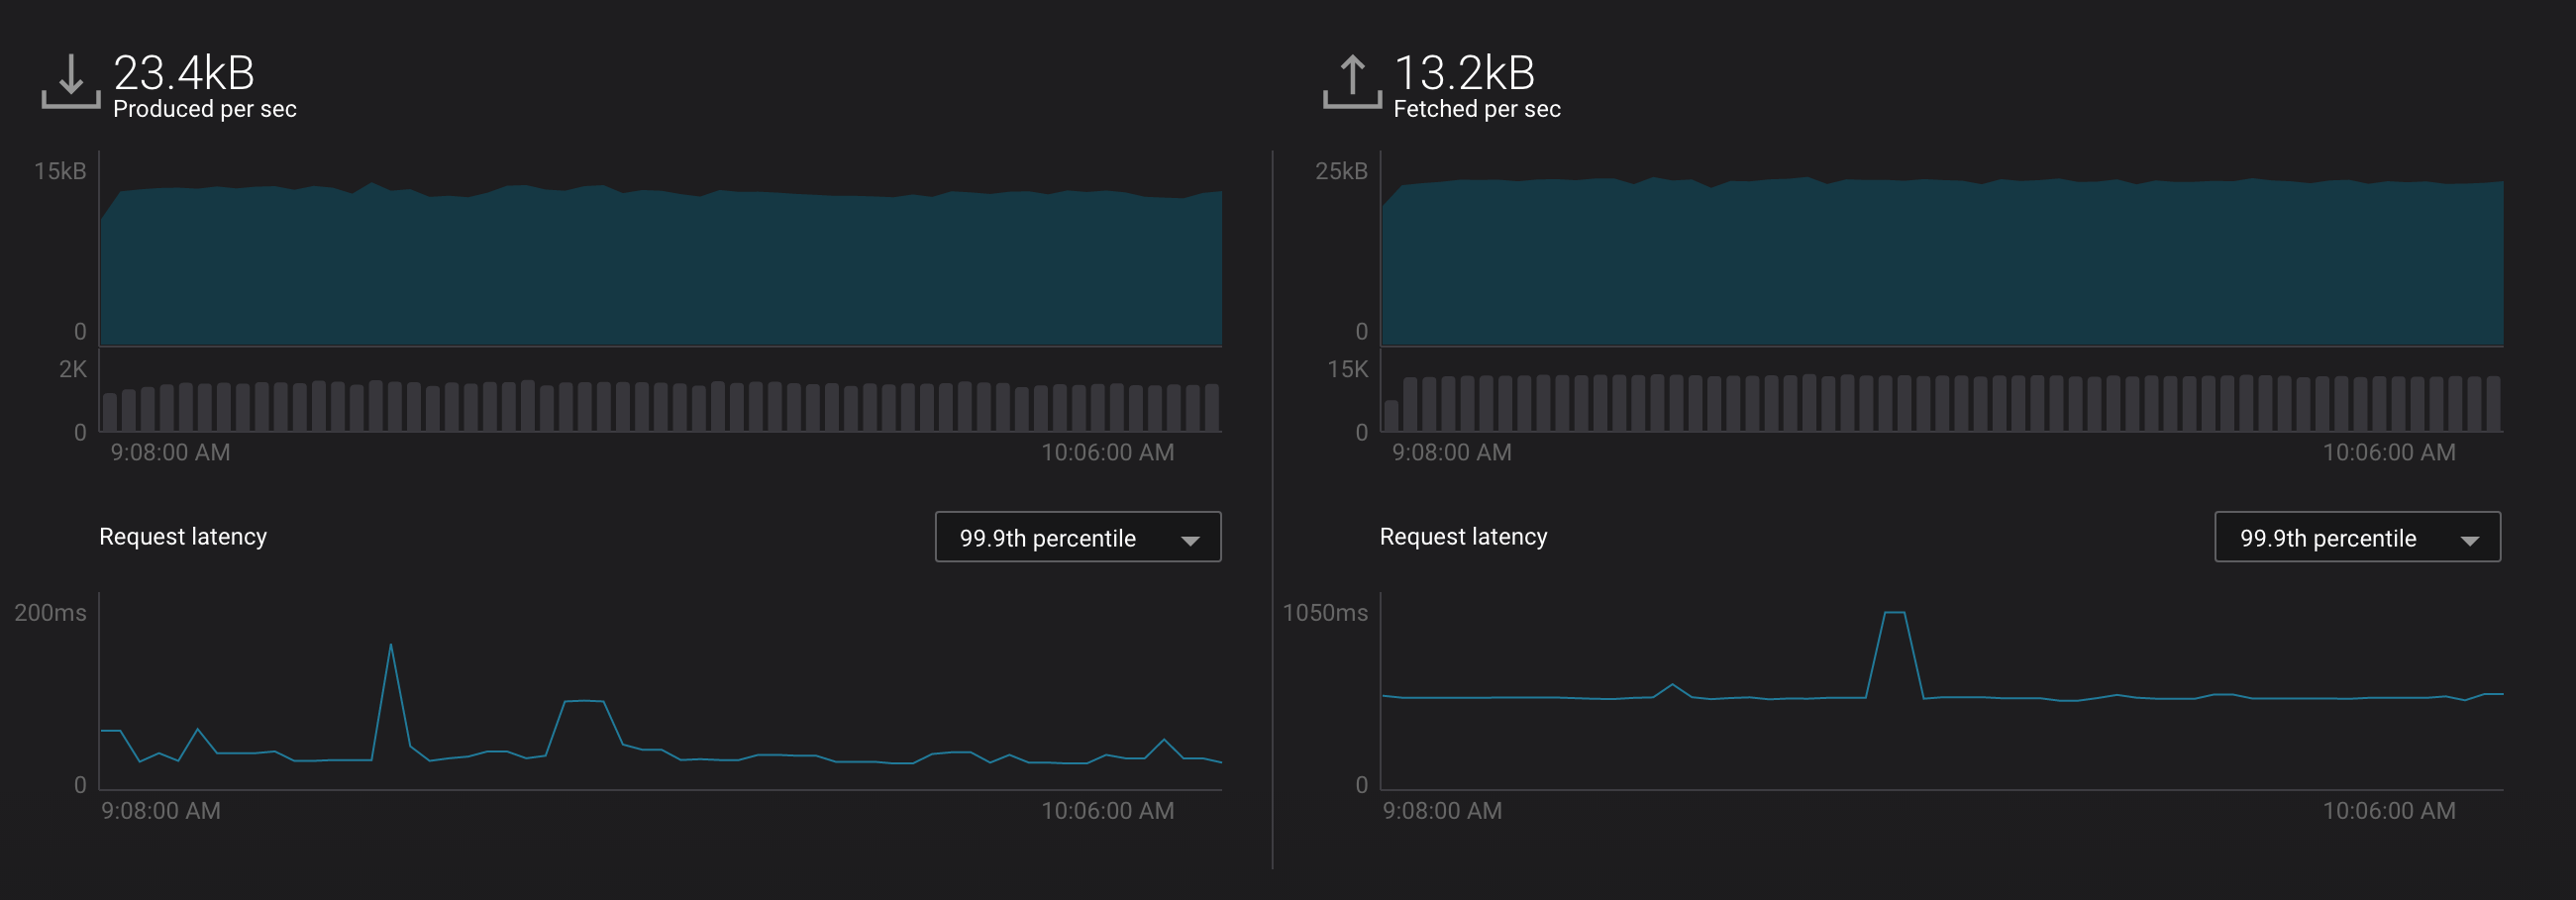
- Produced (left hand side)
- Bytes – total number of bytes per second produced to this cluster
- Requests – total number of successful / failed produce requests to this cluster
- Latency – produce request latency across all brokers, at the median, 95th, 99th, or 99.9th percentile
- Fetched (right hand side):
- Bytes – total number of bytes per second fetched from this cluster
- Requests – total number of successful / failed fetch requests to this cluster
- Latency – fetch request latency across all brokers, at the median, 95th, 99th, or 99.9th percentile
- Per broker or topic breakdown
- Hovering the mouse cursor over an individual row of the broker or topic table will overlay the request statistics for that individual broker or topic in the chart.
- Request latency (broker view only)
In the broker section, the request latency for each broker will appear as its own line in the bottom-most chart.
Hovering the mouse cursor over a specific line will highlight the corresponding row for that particular broker in the table.
- Request lifecycle (broker view only)
Clicking a line inside the latency chart will display the breakdown of produce or fetch latency throughout the entire request lifecycle.
The request latency profile can shown at the median, 95th, 99th, or 99.9th percentile by selecting the corresponding header.
Broker Aggregate Metrics
- Broker count
- Number of brokers currently online
- Zookeeper
ZooKeeper status - Up or Down
Expires
rate at which brokers are experiencing ZooKeeper session expirations (number of expirations per second)
Leader elections
Number of partition leader elections
- Active controller
- Number of brokers reporting as the active controller
- Unclean elections
Number of unclean partition leader elections
When unclean leader election is held among out-of-sync replicas, there is a possibility of data loss if any messages were not synced prior to the loss of the former leader.
- Network pool usage
- Average network pool capacity usage across all brokers
- Request pool usage
- Average request handler capacity usage across all brokers (i.e. the fraction of time request handler threads are not sitting idle)
- Disk usage
Disk usage distribution - indicates whether disk usage distribution is even or skewed across all brokers in a cluster
Disk usage is determined to be skewed if the relative mean absolute difference of all broker sizes exceeds 10%.
- Online topic partitions
- Total number of online topic partitions
- Under replicated topic partitions
- Total number of topic partitions that are under-replicated (i.e. partition with in-sync replicas < replication factor)
- Offline topic partitions
Total number of partitions that are offline
A partition could be offline if for instance the number of available replicas for the partition is less than the configured minimum in-sync replicas.
Broker Metrics Table
- Id
- Id for this broker
- Throughput
- Bytes In / Bytes Out – Number of bytes per second produced to, or fetched from this broker (including from other brokers as part of replication)
- Latency (produce)
- Latency of produce requests to this broker at the median, 95th, 99th, or 99.9th percentile (in milliseconds)
- Latency (fetched)
- Latency of fetch requests to this broker at the median, 95th, 99th, or 99.9th percentile (in milliseconds)
- Partition replicas
- Total number of partition replicas served by this broker
- Segment
- Total size in bytes of the log segments served by this broker (excluding index size)
- Rack
- Rack Id for this broker
Topic Aggregate Metrics
- Topic count
- Total number of topics
- In sync replicas
- Total number of partition replicas that are in-sync
- Out of sync replicas
- Total number of partition replicas that are out of sync
Topic Metrics Table
- Name
- Topic name
- Throughput
- Bytes In / Bytes Out – Number of bytes per second produced to, or fetched from this topic (including from replicas)
- Partition replicas
Total – Total number of partition replicas for this topic
In Sync – Total number of partition replicas that are in sync
Out of Sync – Total number of partition replicas that are in sync
- Partitions
Total – Number of partitions for this topic
Under replicated – Number of partitions that are under replicated (i.e. partitions with in-sync replicas < replication factor)
- Segment
Count – Number of log segments for this topic across all partition leaders.
Size – Size in bytes of the log for this topic (does not include replicas)
- Offset
Start – Minimum offset across all partitions for this topic
End – Maximum offset across all partitions for this topic