Creating Empty Graphs
Within CloverETL projects, you can create CloverETL graphs.
For example, you can create a graph for the
Project_01 by choosing → → .
You can also right-click the desired project in the
Navigator pane and select → from the context menu.
![[Note]](figures/note.png) | Note |
|---|---|
Creating a new Jobflow works in a similar way. For Profiler Job, see ProfilerProbe. |
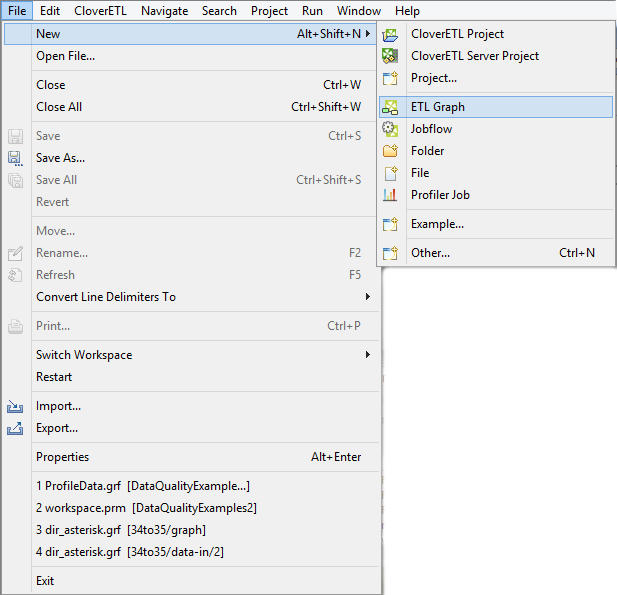
Figure 22.1. Creating a New Graph
After clicking the item, you will be asked to give a name to the graph and a location to place it.
For example, the name can be FirstGraph.grf and the project
Project_01.
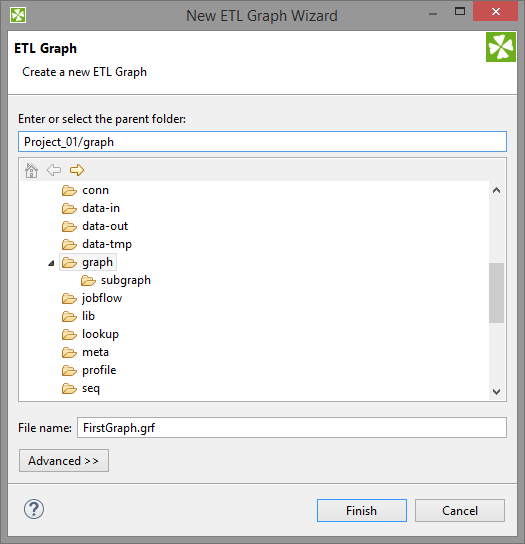
Figure 22.2. Giving a Name to a New CloverETL Graph
By clicking , you save the graph in the chosen subfolder.
The .grf extension will be added to the selected name automatically.
Then, a FirstGraph.grf item appears in the
Navigator pane and a tab named
FirstGraph.grf appears on the window.
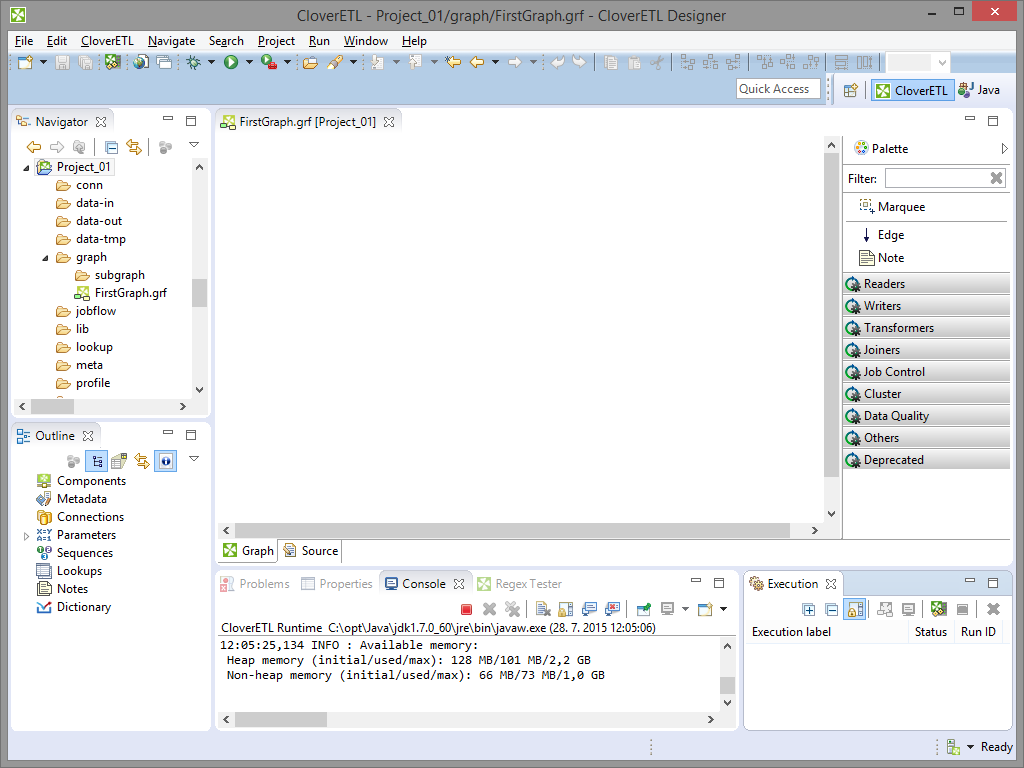 |
Figure 22.3. Graph Editor with a New Graph and the Palette of Components