cbhealthchecker tool
The cbhealthchecker tool generates a health report named Cluster Health Check Report for a cluster.
The report provides data that helps administrators, developers, and testers determine whether a cluster is healthy, has issues that must be addressed soon to prevent future problems, or has issues that must be addressed immediately.
The tool retrieves data from the Couchbase Server monitoring system, aggregates it over a time scale, analyzes the statistics against thresholds, and generates a report. Unlike other command line tools such as cbstats and cbtransfer that use the TAP protocol to obtain data from the monitoring system, cbhealthchecker obtains data by using the REST API and the memcached protocol. For more information about the statistics provided by Couchbase Server.
You can generate reports on the following time scales: minute, hour, day, week, month, and year. The tool outputs an HTML file, a text file, and a JSON file. Each file contains the same information — the only difference between them is the format of the information. All cbhealthchecker output is stored in a reports folder. The tool does not delete any files from the folder. You can delete files manually if the reports folder becomes too large. The path to the output files is displayed when the run finishes.
cbhealthchecker is automatically installed with Couchbase Server. You can find the tool in the following locations, depending upon your platform:
| Operating System | Location |
|---|---|
| Linux | /opt/couchbase/bin/ |
| Windows | C:\Program Files\Couchbase\Server\bin\ |
| Mac OS X | /Applications/Couchbase Server.app/Contents/Resources/couchbase-core/bin/ |
The format of the cbhealthchecker command is:
cbhealthchecker CLUSTER USERNAME PASSWORD OPTIONS
| Option | Syntax | Description |
|---|---|---|
| CLUSTER | -c HOST[:PORT] --cluster=HOST[:PORT] | Hostname and port of a node in the cluster. The default port is 8091. |
| USERNAME | -u USERNAME --user=USERNAME | Admin username of the cluster. |
| PASSWORD | -p PASSWORD --password=PASSWORD | Admin password of the cluster. |
| OPTIONS | -b BUCKETNAME --bucket=BUCKETNAME | Specific bucket on which to report. The default is all buckets. |
| -i FILENAME --input=FILENAME | Generate an analysis report from an input JSON file. | |
| -o FILENAME --output=FILENAME | File name for the HTML report. The default output file name is the report time stamp, for example: 2013-07-26_13-26-23.html. | |
| -h --help | Show the help message and exit. | |
| -s SCALE --scale=SCALE | Time span (scale) for the statistics: minute, hour, day, week, month or year. The default time span is day. | |
| -j --jsononly | Collect data and output only a JSON file. When you use this option, the analysis report is not generated. |
Sample Commands
The following command runs a report on all buckets in the cluster for the past day:
./cbhealthchecker -c 10.3.1.10:8091 -u Administrator -p password

bucket: default
  node: 10.3.1.10 11210
  node: 10.3.1.11 11210
................................

The run finished successfully.
Please find html output at '/opt/couchbase/bin/reports/2013-07-23_16-29-02.html'
and text output at '/opt/couchbase/bin/reports/2013-07-23_16-29-02.txt'.
The following command runs a report on all buckets in the cluster for the past month:
./cbhealthchecker -c 10.3.1.10:8091 -u Administrator -p password -s month

The run finished successfully.
Please find html output at '/opt/couchbase/bin/reports/2013-07-26_13-26-23.html'
and text output at '/opt/couchbase/bin/reports/2013-07-26_13-26-23.txt'.
The following command runs a report on only the beer-sample bucket for the past year and outputs the HTML report to a file named beer-health-report.html.
./cbhealthchecker -c 10.3.1.10:8091 -u Administrator -p password -o beer-health-report.html \
      -b beer-sample -s year

The run finished successfully.
Please find html output at '/opt/couchbase/bin/reports/beer-health-report.html'
and text output at '/opt/couchbase/bin/reports/2013-07-26_15-57-11.txt'.
The following command generates only the statistics and outputs them in a JSON file:
./cbhealthchecker -c 10.3.1.10:8091 -u Administrator -p password -j

The run finished successfully.
Please find collected stats at '/opt/couchbase/bin/reports/2013-07-26_13-30-36.json'.
HTML Report
You can view the HTML report in any web browser. If you copy the report to another location, be sure to copy all the files in the reports folder to ensure that the report is displayed correctly by the browser. When you have multiple HTML reports in the folder, you can use the tabs at the top of the page to display a particular report. (If the tabs do not function in your browser, try using Firefox.)
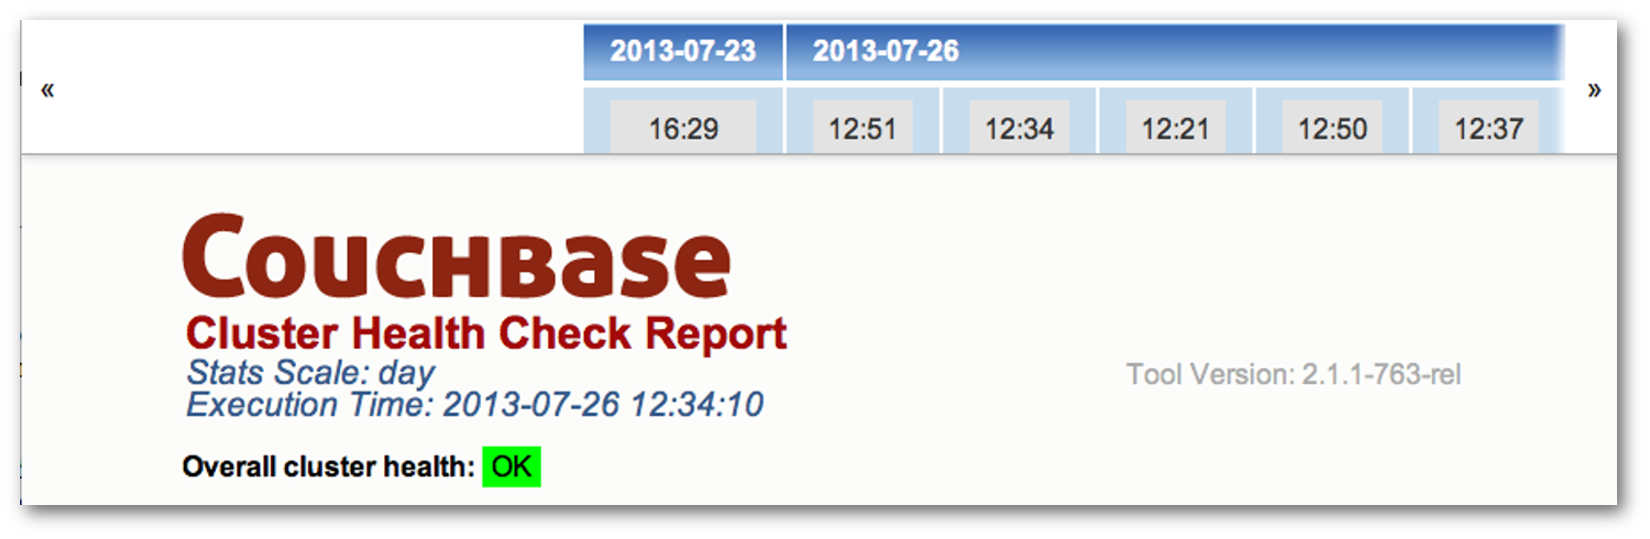
Throughout the report, normal health statuses are highlighted in green, warnings are highlighted in yellow, and conditions that require immediate action are highlighted in red. When viewing the report, you can hover your mouse over each statistic to display a message that describes how the statistic is calculated.
The report begins with a header that lists the statistics scale, the date and time the report was run, and an assessment of the overall health of the cluster. The following figure shows the report header:
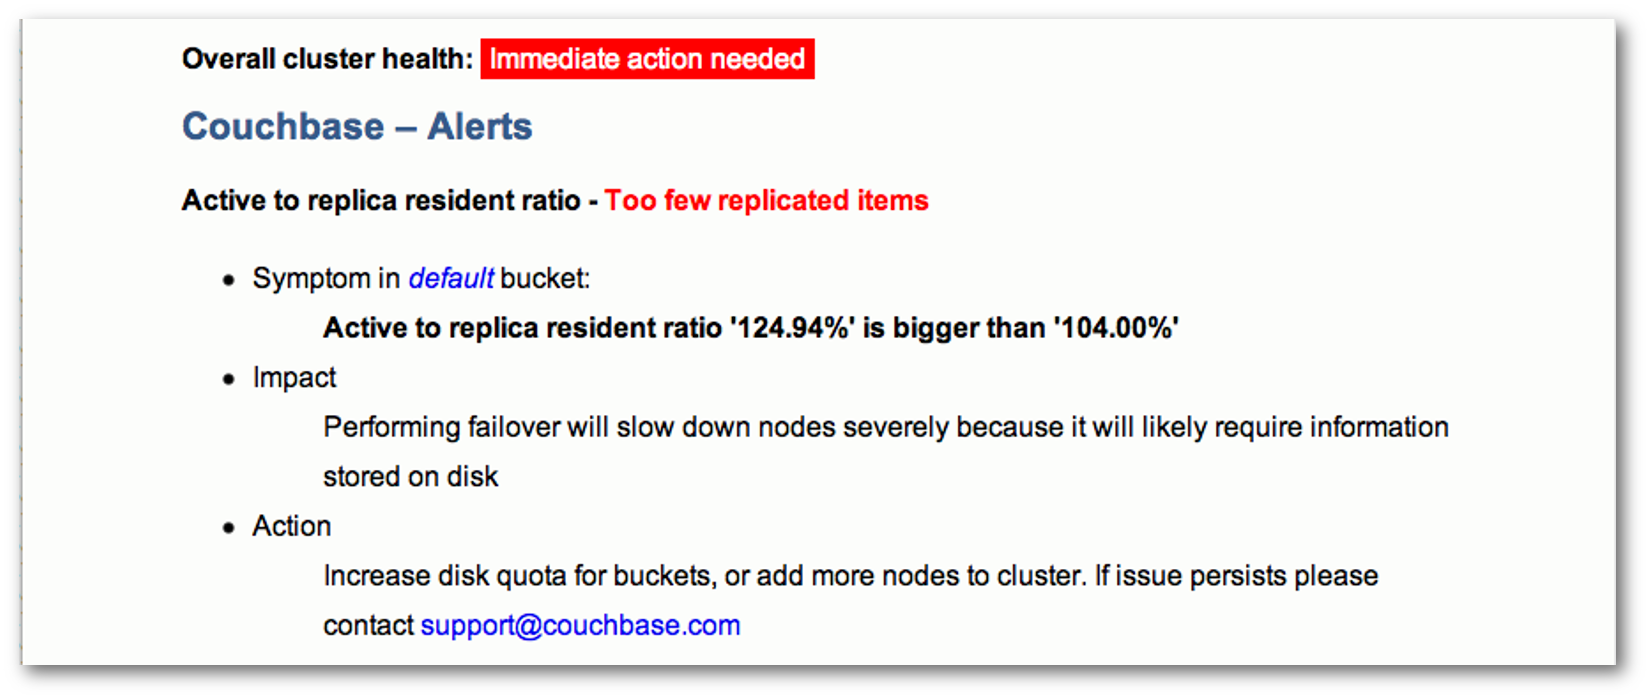
- The body of the report is divided into several sections:Couchbase — Alerts
The alerts section contains a list of urgent issues that require immediate attention. For each issue, the report lists the symptoms detected, the impact of the issue, and the recommended corrective action to take. This section appears in the report only when urgent issues are detected. The following figure shows a portion of the alerts section of a report:
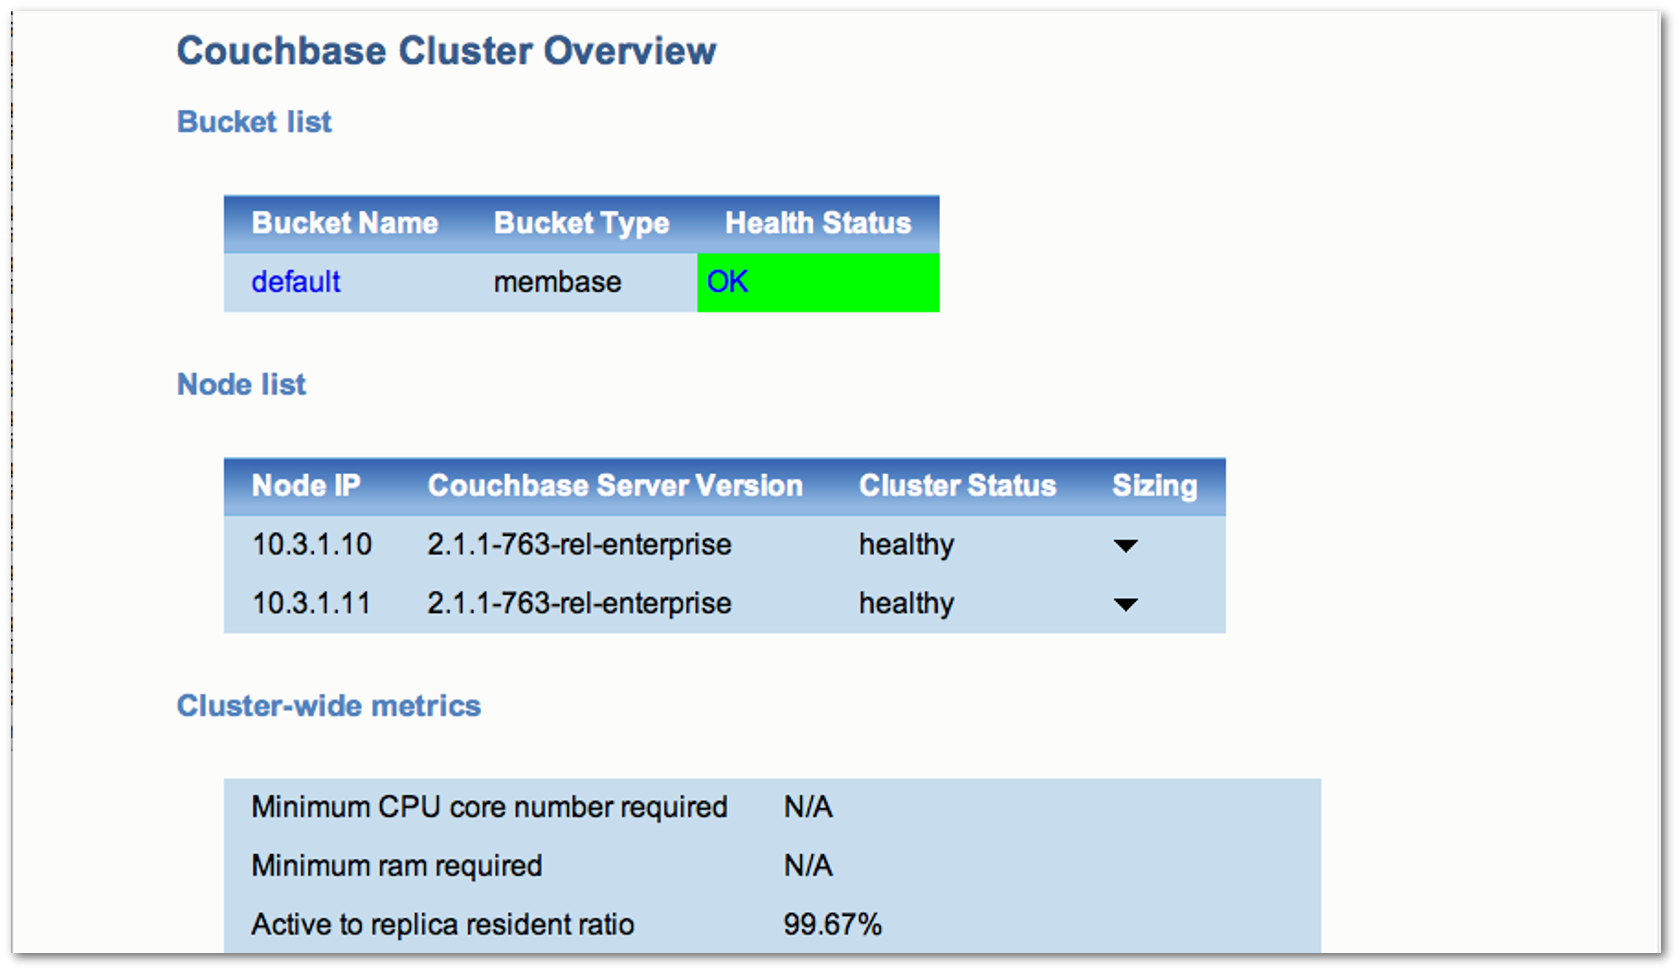
- Couchbase Cluster Overview
The cluster overview section contains cluster-wide metrics and metrics for each bucket and node in the cluster. This section appears in all reports. The following figure shows a portion of the cluster overview section of a report:
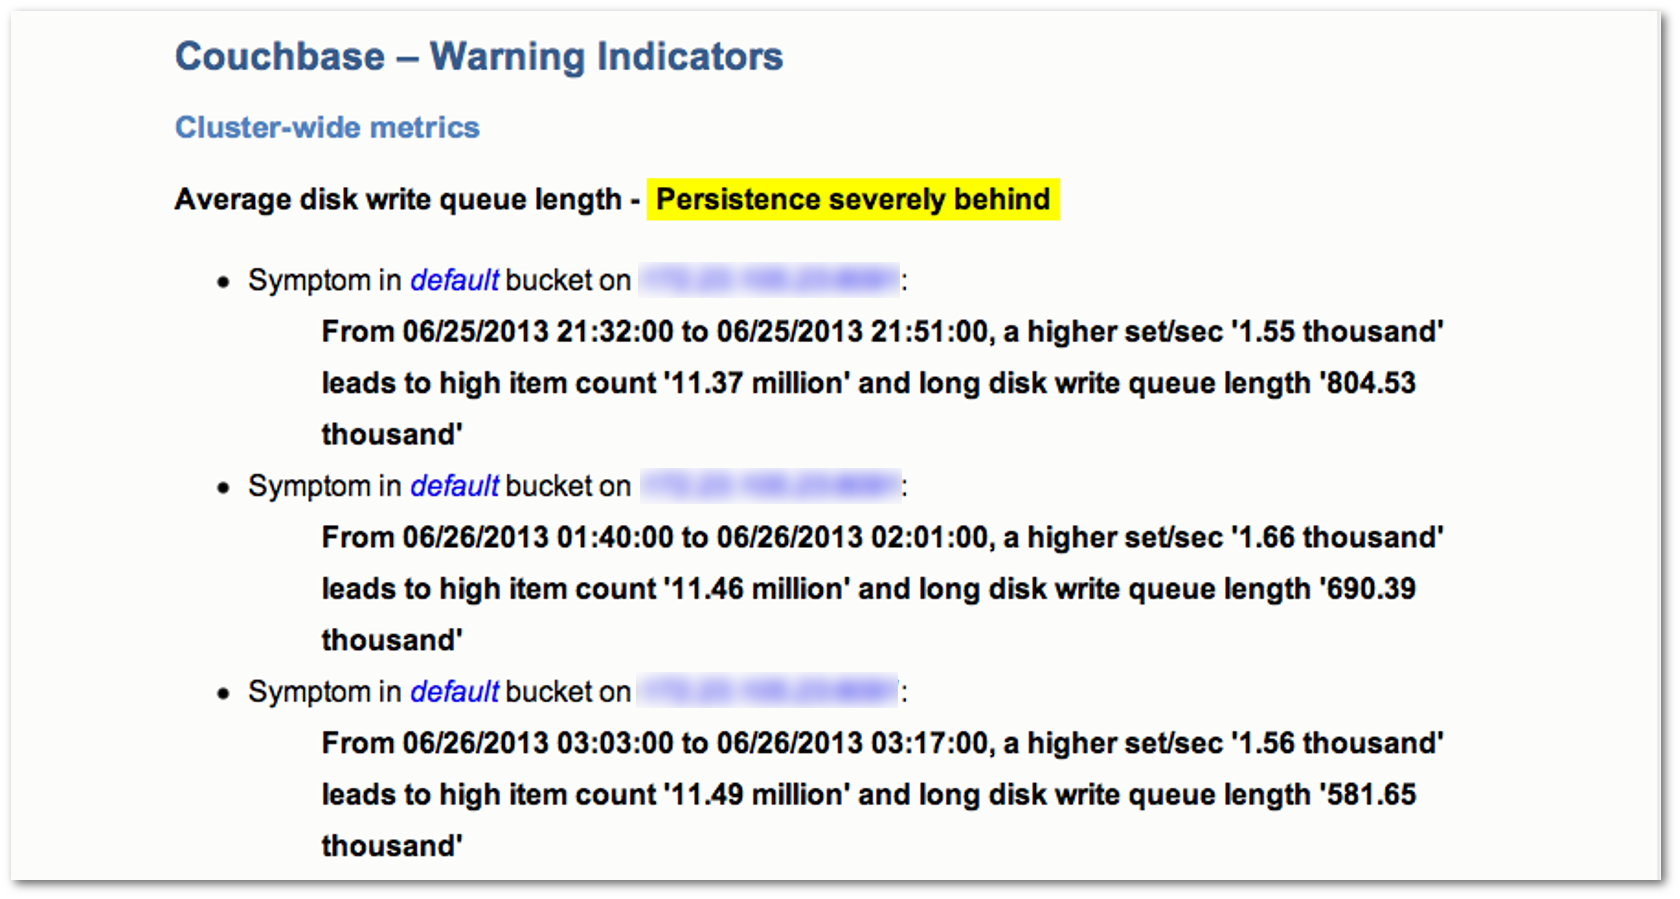
- Couchbase — Warning Indicators
The warning indicators section contains a list of issues that require attention. For each issue, the report lists the symptoms detected, the impact of the issue, and the recommended corrective action to take. This section appears in the report only when warning indicators are detected. The following figure shows a portion of the warning indicators section of a report: