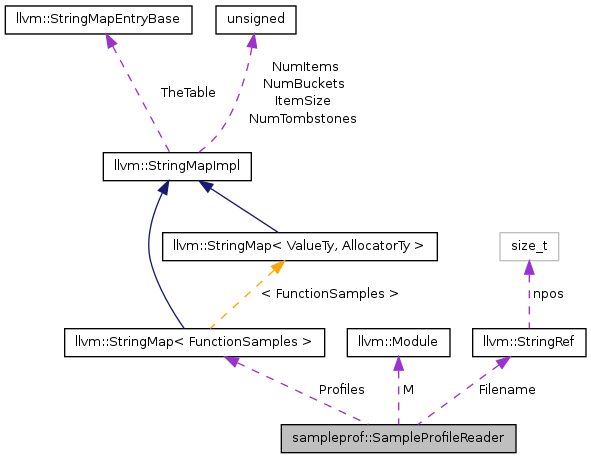
Sample-based profile reader. More...
#include <SampleProfReader.h>

Public Member Functions | |
| SampleProfileReader (const Module &M, StringRef F) | |
| void | dump () |
| Print all the profiles to dbgs(). | |
| bool | load () |
| Load sample profiles from the associated file. | |
| void | printFunctionProfile (raw_ostream &OS, StringRef FName) |
Print the profile for FName on stream OS. | |
| void | dumpFunctionProfile (StringRef FName) |
Print the profile for FName on dbgs(). | |
| FunctionSamples * | getSamplesFor (const Function &F) |
Return the samples collected for function F. | |
| void | reportParseError (int64_t LineNumber, Twine Msg) const |
| Report a parse error message. | |
Protected Member Functions | |
| bool | loadText () |
| Load samples from a text file. | |
| bool | loadBitcode () |
Protected Attributes | |
| StringMap< FunctionSamples > | Profiles |
| Map every function to its associated profile. | |
| StringRef | Filename |
| Path name to the file holding the profile data. | |
| const Module & | M |
| Module being compiled. Used to access the current LLVM context for diagnostics. | |
Detailed Description
Sample-based profile reader.
Each profile contains sample counts for all the functions executed. Inside each function, statements are annotated with the collected samples on all the instructions associated with that statement.
For this to produce meaningful data, the program needs to be compiled with some debug information (at minimum, line numbers: -gline-tables-only). Otherwise, it will be impossible to match IR instructions to the line numbers collected by the profiler.
From the profile file, we are interested in collecting the following information:
A list of functions included in the profile (mangled names).
For each function F: 1. The total number of samples collected in F.
2. The samples collected at each line in F. To provide some protection against source code shuffling, line numbers should be relative to the start of the function.
The reader supports two file formats: text and bitcode. The text format is useful for debugging and testing, while the bitcode format is more compact. They can both be used interchangeably.
Definition at line 145 of file SampleProfReader.h.
Constructor & Destructor Documentation
| sampleprof::SampleProfileReader::SampleProfileReader | ( | const Module & | M, |
| StringRef | F | ||
| ) | [inline] |
Definition at line 147 of file SampleProfReader.h.
Member Function Documentation
| void SampleProfileReader::dump | ( | ) |
Print all the profiles to dbgs().
Dump all the function profiles found.
Definition at line 140 of file SampleProfReader.cpp.
References I.
| void SampleProfileReader::dumpFunctionProfile | ( | StringRef | FName | ) |
Print the profile for FName on dbgs().
Dump the function profile for FName.
- Parameters:
-
FName Name of the function to print.
Definition at line 135 of file SampleProfReader.cpp.
References llvm::dbgs().
| FunctionSamples* sampleprof::SampleProfileReader::getSamplesFor | ( | const Function & | F | ) | [inline] |
Return the samples collected for function F.
Definition at line 163 of file SampleProfReader.h.
References llvm::Value::getName().
Load sample profiles from the associated file.
Load execution samples from a file.
This function examines the header of the given file to determine whether to use the text or the bitcode loader.
Definition at line 235 of file SampleProfReader.cpp.
| bool sampleprof::SampleProfileReader::loadBitcode | ( | ) | [inline, protected] |
Definition at line 175 of file SampleProfReader.h.
References llvm_unreachable.
| bool SampleProfileReader::loadText | ( | ) | [protected] |
Load samples from a text file.
See the documentation at the top of the file for an explanation of the expected format.
- Returns:
- true if the file was loaded successfully, false otherwise.
Definition at line 153 of file SampleProfReader.cpp.
References sampleprof::FunctionSamples::addBodySamples(), sampleprof::FunctionSamples::addHeadSamples(), sampleprof::FunctionSamples::addTotalSamples(), llvm::ErrorOr< T >::get(), llvm::ErrorOr< T >::getError(), llvm::line_iterator::is_at_eof(), llvm::LibFunc::isdigit, llvm::line_iterator::line_number(), llvm::Regex::match(), and llvm::SmallVectorTemplateCommon< T >::size().
| void SampleProfileReader::printFunctionProfile | ( | raw_ostream & | OS, |
| StringRef | FName | ||
| ) |
Print the profile for FName on stream OS.
Print the function profile for FName on stream OS.
- Parameters:
-
OS Stream to emit the output to. FName Name of the function to print.
Definition at line 126 of file SampleProfReader.cpp.
| void sampleprof::SampleProfileReader::reportParseError | ( | int64_t | LineNumber, |
| Twine | Msg | ||
| ) | const [inline] |
Report a parse error message.
Definition at line 168 of file SampleProfReader.h.
Member Data Documentation
StringRef sampleprof::SampleProfileReader::Filename [protected] |
Path name to the file holding the profile data.
Definition at line 185 of file SampleProfReader.h.
const Module& sampleprof::SampleProfileReader::M [protected] |
Module being compiled. Used to access the current LLVM context for diagnostics.
Definition at line 189 of file SampleProfReader.h.
Map every function to its associated profile.
The profile of every function executed at runtime is collected in the structure FunctionSamples. This maps function objects to their corresponding profiles.
Definition at line 182 of file SampleProfReader.h.
The documentation for this class was generated from the following files:
 1.7.6.1