| Documentation | |
|---|---|
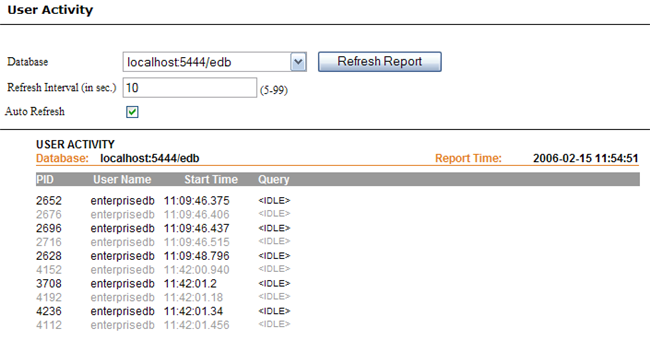
20.5. MonitoringThe following reports are available for monitoring database activity: The User Activity and Lock Status reports are exceedingly dynamic and real time in nature. The Buffer Cache report gives an insight of the database's buffer cache, user indexes and tables currently in the cache. Whereas, the Configuration and Show Settings reports are more static in nature. For all these reports except Configuration, the database name and address can be seen on the top left, whereas, the exact date and time of report generation is mentioned over the top right corner of each report. 20.5.1. User Activity ReportThis report contains the information about the current user activity within a specific database. This is primarly the number of active sessions associated with that database. The User Activity report contains the process ID, user name, the time that user activity was initiated, and the query being issued by that particular session. This report is particularly useful in order to have a real time view of current database activity. However, keep in mind that the there is an internal delay of approximately 10 seconds between actual execution of the query and when it is reported in the database catalog. Hence this view will be a 10 seconds older snapshot of the actual database activity.
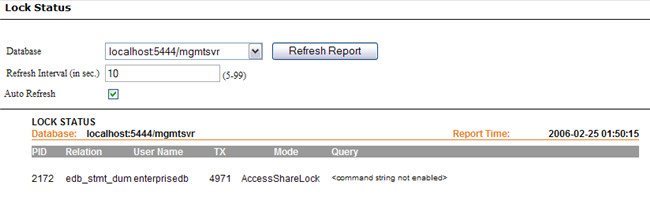
20.5.2. Lock Status ReportThe report provides access to information about the locks held by open transactions within the database server. Each row represents an active lockable object, requested lock mode, and the relevant transaction number. The same lockable object may appear mulitple times, if multiple transactions are holding or waiting against that object. This report can be particularly useful for detecting deadlocks. However, there is an internal delay of approximately 10 seconds between actual execution of the query and when it is reported in the database catalog. Hence this view will be a 10 seconds older snapshot of the actual lock status. 10 seconds is the default refresh interval for this report, this can default can be changed to any value between 5-99 seconds by typing in the desired refresh period in the Refersh Interval textbox.
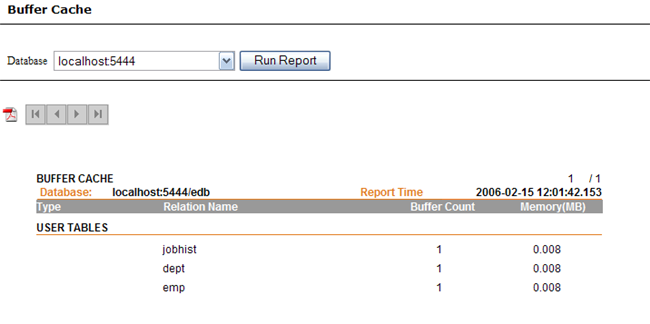
20.5.3. Buffer CacheThis report shows information about real time queries on the shared buffer cache. Each row in this report represents a buffer in the shared cache.
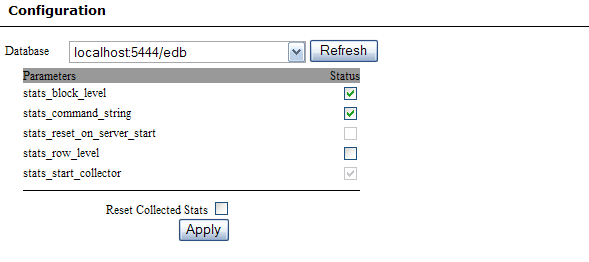
20.5.4. ConfigurationThe parameters shown on this page are some of the runtime configuration parameters of a database. These settings can also be found in the postgresql.conf file. The message in red (as seen in the following picture) shows that the "read only" property of the database is set to be true in the configure.xml file. When the property is set to false, end users can freely change the status of all the parameters. Please note that the option to enable/disable the stats_start_collector and stats_reset_on_server_start parameters is disabled as these parameters cannot be changed at runtime and must only be set at database startup time. To change any of the other parameter values, just select the required check-box and click on the Majority of these parameters enable or disable different levels of statistics collection. The stats_block_level parameter has to be turned stats_command_string The change in state of this parameter is applicable to every new SQL command line session and to all SQL statements except for the SELECT statement that are executed in either existing or new SQL Interactive session. Since all SQL statements in SQL Interactive are auto-committed by default so transactions executed here will not be visible under the Lock Status page. stats_reset_on_server_start and stats_start_collector When both "stats_reset_on_server_start" and "stats_start_collector" are "ON" then the following are displayed:
On the other hand, when "stats_reset_on_server_start" is "ON" and "stats_start_collector" is "OFF" then the following happens:
stats_row_level When this parameter is "ON" then details on row level are being collected and can be seen as under:
But when it is "OFF" then any action done on a row level will not be updated in:
Reset Collected Stats checkbox When the 'Reset Collected Stats' checkbox is checked then it resets the following:
|