| Documentation | |
|---|---|
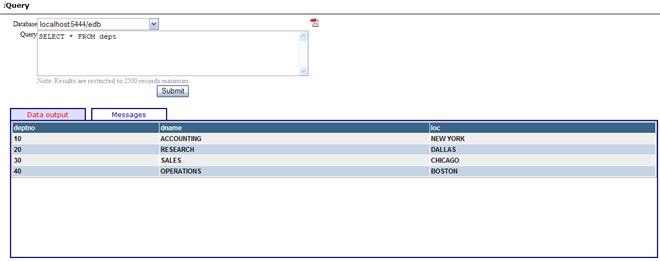
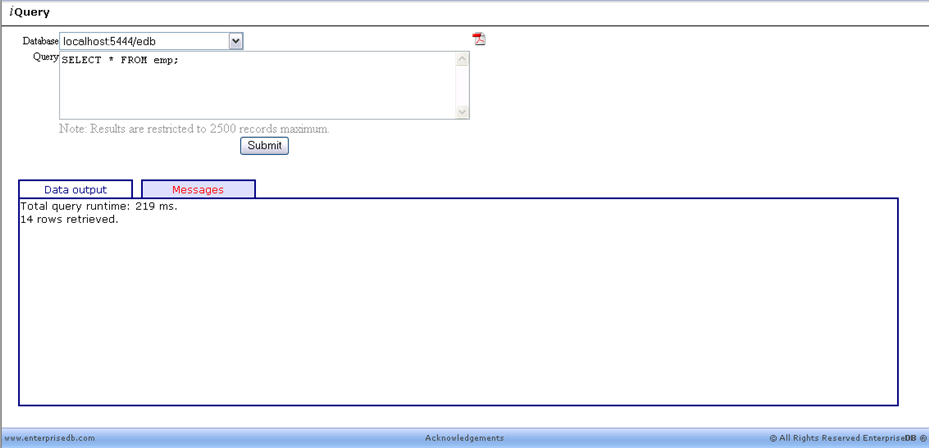
20.7. SQLThe SQL menu option of DBA Management Sever contains the following two options: Following is the explanation of these two features of DBA Management Server. 20.7.1. iQueryiQuery is more than a typical query executor which can be accessed over a webserver. Not only does it show the results of a typical SQL query, but also shows the results for the execution of a stored procedure. The query to be executed is entered in the Query text box, which is executed when the The Data Output text box displays the result of the entered query. The query results are limited to a maximum of 2500 records. Information about the execution time and the output generated through a DBMS_OUTPUT or RAISE statement can be displayed by selecting the Messages Tab. The following two images show the data output and the messages displayed by iQuery after a query has been executed.
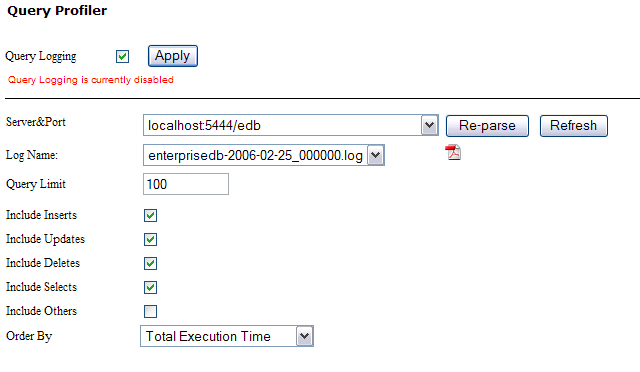
20.7.2. Query ProfilerThe Query Profiler parses your database's log files and gives you a report of the queries pertaining to your database which can greatly help DBA's in improving the performance of their systems. The information made available by Query Profiler can be utilized for two primary purposes:
In order for Query Profiler to function properly, you need to have the log_min_duration_statement configuration parameter set to
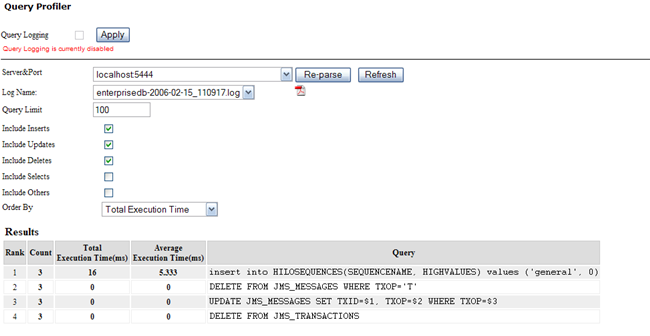
Enabling Query Logging has performance implications though; hence it should only be used to sample the queries for a short period of time to gather your relevant information and then turned off. Query Profiler can be used to rank queries on the basis of Total Execution Time, Average Execution Time and Statement Count (the number of times a query was repeated) which can be done by selecting the required ranking option from the Order By dropdown. You can filter out the type of queries you want to rank, the possible query types include:
You can include/omit a particular query type by checking/unchecking against their respective checkboxes and then pressing the
|