

|
|
|
The Session Detail screen displays detailed information for the selected session.
To display detailed information on a session, position the cursor at a session in the Session List and select More_Info from the Session List menu. The Session Detail pop-up is displayed.
Session Name, Terminal, ID, Database, and Server Facility are the same as on the Session List screen. State is replaced by the expanded state and mask. The expanded state and mask expose details of the internal session state; those details are subject to change between Ingres releases and must be interpreted by qualified support personnel.
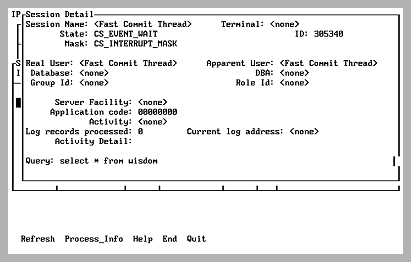
The Session Detail screen displays the following information:
Usually identical. If the session was started with the -u flag to impersonate another user, the apparent user is the user who is being impersonated. For example, if privileged user, ted, started a session with the command sql -ubill dbname, the apparent user is bill and the real user is ted.
The owner of the database (database administrator) to which the session is connected
The group and role IDs, if any, for the current session. These features are part of the Knowledge Management Extension.
Shows the client process ID (PID), which is displayed if the session is being run from a client that is local and interactive (as opposed to batch).
You can observe the client process's Job and Process (JPI) parameters using the Process_Info menu item from the Detailed Process Information screen.
Appears on VMS.
The internal thread ID (TID). TID is displayed in the Session Details screen when Ingres is using OS threads.
Appears on UNIX.
Current state of the session. Possible states are as follows:
A normal abort is being performed (that is, the user issued a rollback, deadlock, and so on).
An abort of an old transaction is in process.
An abort is taking place due to an interrupt (Control C).
An abort is taking place for a session that is terminating ungracefully.
A session is terminating normally.
A session that is starting up is retrieving iidbdb information. This can show up for extended periods due to locks on the iidbdb, or the logging system is full.
The optimizer is at work.
The Event Thread is usually in this state.
Number of log records processed and current log address being processed when the session is backing out the transaction due to any cause. This allows visual confirmation that the server is indeed doing work on the rollout. Periodic refreshes give a measure of the progress in performing the rollout.
Causes of backing out include:
Caution! The session that is being rolled out must never be removed, nor can the server containing that session be terminated in any way.
The first 128 characters of the query currently running is shown. A current query is one being processed by the Ingres DBMS Server, not a query that has returned results and finished executing, even though the user has not committed. This field is active only if the user running IPM is a privileged user.
|
|
|
The Session Detail screen has the following menu items:
Queries the specified server for new session detail for the specified session and refresh the display. If the server or session no longer exists, a message is printed.
Valid on VMS.
Displays a screen that shows job-process information for the client that is being examined. The client process must be local and interactive (not in batch) for this option to work: a PID cannot be obtained for a session's client unless the client is tied to a terminal. Information displayed includes CPU time, Direct I/O, Buffered I/O, Enqueue limit, etc. This display automatically refreshes. For more information on process_info menu item, see Detailed Process Information Screen (VMS Only).
Displays help screens.
Returns to the Session List screen.
Exits IPM.