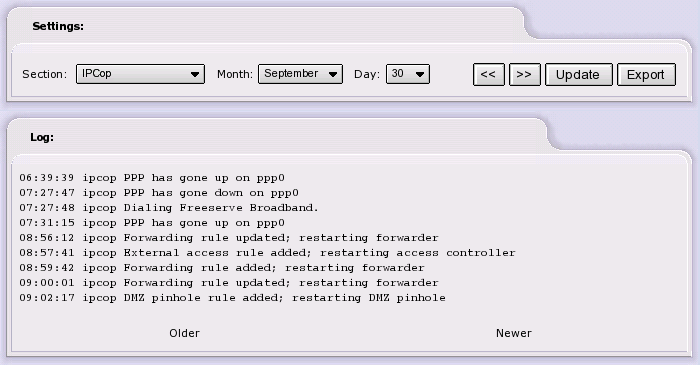
The Logs AW Consists of five or six sub-pages - , , , , (if enabled) and . These share a common set of interface features to select the log information to be displayed, and to export that information to your local machine. Dropdown Month: and Day: lists in the Settings: area of the AW are provided to allow you to select Logs information for preceding days and months. Each time that you select a new combination of Month: and Day:, you must also click the button before the Logs information will be updated. When you first select a sub-page, the Logs information displayed will be that for the current date.
The << button lets you quickly jump back a day, and the >> button moves a day forward.
The Logs information appears as a list in the main section of the window (usually labeled Log:). If that list is too long to fit into a reasonably sized window, only the latest Logs information is displayed. In that situation, the Older and Newer links at the top and bottom of this section of the window become active and you may use these to page through the list of Logs data.
Pressing the
button downloads a text-format file
(log.dat), containing the
information from the current Logs AW page, from the
IPCop server to your computer. Depending on how your
computer is set up, pressing the
button will initiate a file download
dialogue on your computer, show the contents of
log.dat in your web browser
window, or open the file in a text editor. In the
latter cases, you can save
log.dat as a text-format
file if required.
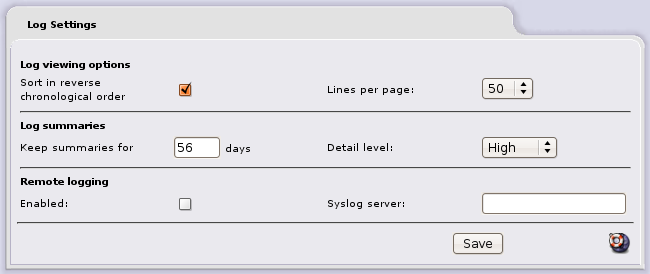
Log Settings. This page allows you to control how the logs are displayed, specify the detail level and how long the log summaries are kept for, and control remote logging.
Click the button after making any changes to save the settings and restart the syslogd daemon.
Sort in reverse chronological order. Check the Sort in reverse chronological order checkbox if you want to see recent events at the top of a page, rather than at the bottom.
Lines per page. Select the number of log entries to display on a page from the Lines per page drop down menu. This can vary from between 15 and 500. Be aware that a large number of lines will take longer to process and display on slower hardware.
Keep summaries for n days. You can choose how long the logwatch summaries are kept on IPCop. If you are short of disk space, reduce the number of days.
Detail level. You can choose between Low, Medium and High levels of detail in the logwatch summaries from the Detail level drop down menu.
Remote logging. Select the Enabled checkbox to allow logging to a remote syslog server.
Specify the hostname or
hostname.domainname or IP Address of the
remote server in the Syslog server field
provided.
All logs will be forwarded to that server.
Remember to click the button after making any changes.
Displays the summary generated by logwatch for the previous day.
No (or only partial) logs exist for the day queried
Each logwatch summary is generated at midnight, and covers the preceding day's events. If you do not run your IPCop server overnight, you may not be able to view any summaries.
This page provides you with the facility to see the files that have been cached by the web proxy server within IPCop. The web proxy is inactive after first installation of IPCop, and may be activated (and deactivated) through a specific administration page ( > ).
Note
The Proxy Log menu item will only appear if you have enabled logging on the > page.
Due to the large amount of information that has to be processed, the Web Proxy page can take an appreciable time to appear after its initial selection or an Update.
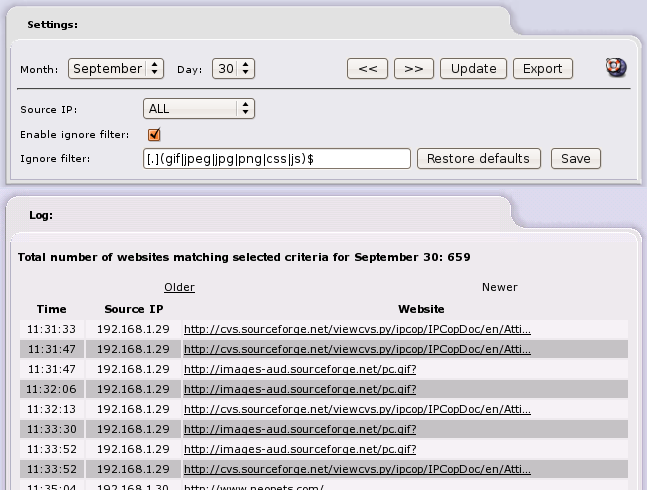
There are several controls on this page in addition to the basic Month, Day, << (Day before), >> (Day after), and controls described at the beginning of this Section:
The Source IP: dropdown box allows you selectively look at web proxy activity related to individual IP addresses on the local network, or the activity related to ALL machines that have used the proxy.
The Ignore filter: box allows you type in a regular expressions text string to define which file types should be omitted from the web proxy Logs. The default string hides image files (
.gif.jpeg.jpg&.png), stylesheet files (.css) and JavaScript files (.js).The Enable ignore filter: tick box allows you to control whether the Ignore filter: is active or not.
The Restore defaults button allows you to return the above controls and filters to their defaults.
For this page, the Logs information appearing in the Log: section of the window consists of:
The Time the file was requested and cached.
The Source IP address of the local system requesting the file.
The Website - or more precisely the URL for each file requested and cached.
Note
The Website URL entries in these Logs are also hyperlinks to the referenced web pages or files.
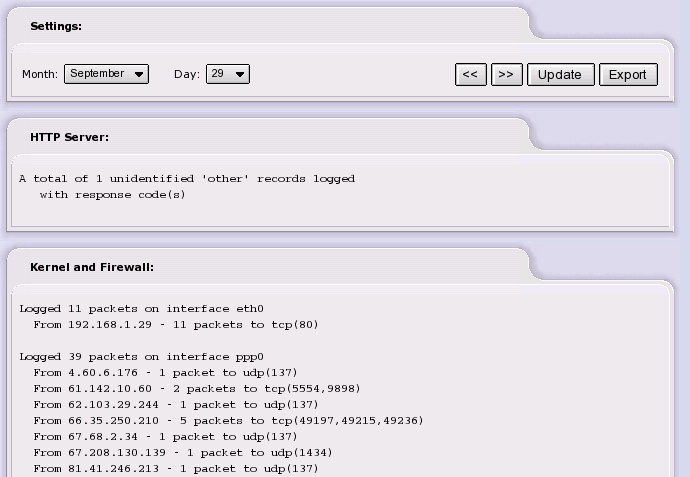
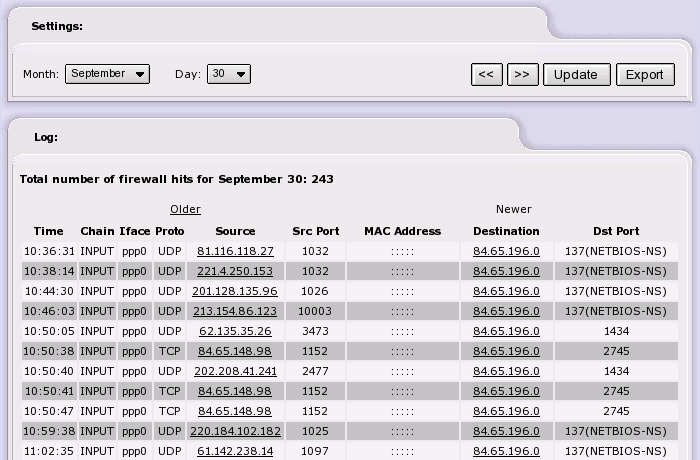
This page shows data packets that have been blocked by the IPCop firewall.
Note
Not all denied packets are hostile attempts by crackers to gain access to your machine. Blocked packets commonly occur for a number of harmless reasons and many can be safely ignored. Among these may be attempted connections to the "ident/auth" port (113), which are blocked by default in IPCop.
The controls on this page are the basic Month, Day, << (Day before), >> (Day after), and buttons that are described in detail at the beginning of this Section.
The Log: section of this page contains an entry for each of the packets that were "dropped" by the firewall. Included is the time of the event, the Source and Destination IP addresses and ports for the dropped packet, the protocol used for that packet, and the IPCop Chain and Interface involved.
You can obtain information about the listed IP addresses by clicking on an IP Address. IPCop performs a DNS lookup and reports any available information about its registration and ownership.
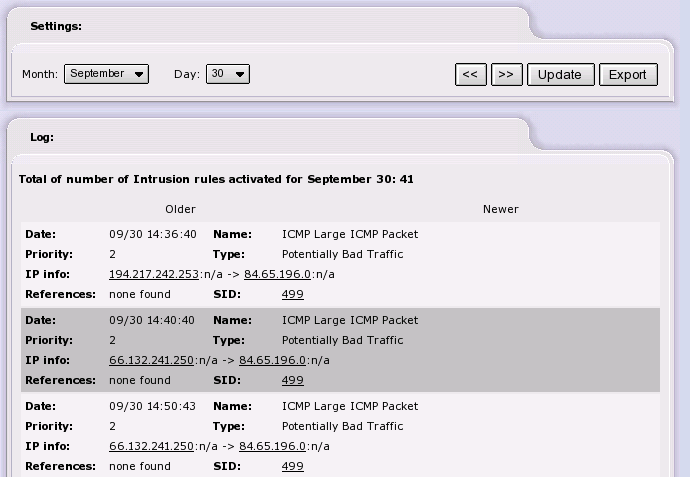
This page shows incidents detected by the IPCop Intrusion Detection System (IDS). The IDS system is inactive after first installation of IPCop, and may be activated (and deactivated) through a specific administration page ( > ).
The controls on this page are the basic Month, Day, << (Day before), >> (Day after), and buttons that are described in detail at the beginning of this Section. These allow you to examine the IDS Logs for a specific day. These Logs consist of a number of items for each detected incident:
The Date: and time of the incident.
Name: - a description of the incident.
Priority: (if available). This is the severity of the incident, graded as 1 ("bad"), 2 ("not too bad"), & 3 ("possibly bad").
Type: - a general description of the incident (if available).
IP Info: - the IP identities (address & port) of the source and target involved in the incident. Each IP address is a hyperlink, which you can use to perform a DNS lookup for that IP address and obtain any available information about its registration and ownership.
References: - hyperlinked URLs to any available sources of information for this type of incident.
SID: - the Snort ID number (if available). "Snort" is the software module used by IPCop to provide the IDS function, and SID is the ID code used by the Snort module to identify a particular pattern of attack. This parameter is hyperlinked to a web page carrying the relevant entry on the Snort database of intrusion signatures.
This page allows you to view the system and other miscellaneous Logs. (See the beginning of this Section on how to use the Month, Day, << (Day before), >> (Day after) and controls). There are twelve different categories, selected via the Section dropdown list:
IPCop (default) - general IPCop events like PPP profile saving and connection ("
PPP has gone up on ppp0") and disconnection ("PPP has gone down on ppp0") of dialup modem links.RED - traffic sent over the interface that is providing the PPP interface for IPCop. This includes the data strings sent to, and received from modems and other network interfaces. This can be a very useful resource in troubleshooting "failure to connect" situations.
DNS - shows a log of activity for dnsmasq, the domain name service utility.
DHCP server - shows a log of activity for the DHCP Server function within IPCop.
SSH - provides a record of users who have logged in to, and out of the IPCop server over a network via the SSH interface.
NTP - shows a log of activity for the ntpd Server function.
Cron - provides a record of activity of the cron daemon.
Login/Logout- provides a record of users who have logged in to, and out of the IPCop server. This includes both local log-ins and logins over a network via the SSH interface.
Kernel - is a record of kernel activity in the IPCop server.
IPSec - is a record of activity of IPSec - the VPN software module used by IPCop.
Update transcript - is a log of the results of any updates applied to the IPCop software via the > window.
Snort - shows a log of activity for Snort, the Intrusion Detection System.