Public Member Functions | |
| __construct ($params) | |
| calltreeCount ($stack, $start) | |
| Counts the number of profiled function calls sitting under the given point in the call graph. | |
| close () | |
| Close opened profiling sections. | |
| debug ($s) | |
| Add an entry in the debug log file. | |
| getCallTree () | |
| Returns a tree of function call instead of a list of functions. | |
| getCallTreeLine ($entry) | |
| Callback to get a formatted line for the call tree. | |
| getCurrentSection () | |
| Get the function name of the current profiling section. | |
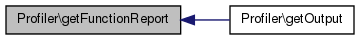
| getFunctionReport () | |
| Returns a list of profiled functions. | |
| getOutput () | |
| Returns a profiling output to be stored in debug file. | |
| getProfileID () | |
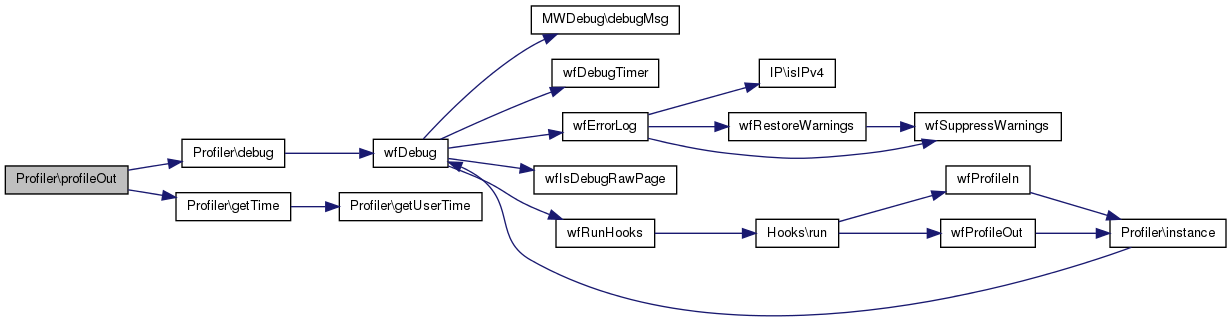
| getTime () | |
| getUserTime () | |
| isStub () | |
| Return whether this a stub profiler. | |
| logData () | |
| Log the whole profiling data into the database. | |
| profileIn ($functionname) | |
| Called by wfProfieIn() | |
| profileOut ($functionname) | |
| Called by wfProfieOut() | |
| remapCallTree ($stack) | |
| Recursive function the format the current profiling array into a tree. | |
| setProfileID ($id) | |
| setTemplated ($t) | |
| Mark this call as templated or not. | |
Static Public Member Functions | |
| static | instance () |
| Singleton. | |
| static | setInstance (Profiler $p) |
| Set the profiler to a specific profiler instance. | |
Public Attributes | |
| $mCalls = array () | |
| $mCollated = array () | |
| $mCollateDone = false | |
| $mTemplated = false | |
| $mTotals = array () | |
| $mWorkStack = array () | |
Protected Member Functions | |
| collateData () | |
Static Protected Member Functions | |
| static | calculateOverhead ($profileCount) |
| Dummy calls to wfProfileIn/wfProfileOut to calculate its overhead. | |
Protected Attributes | |
| $mProfileID = false | |
| $mStack = array() | |
| $mTimeMetric = 'wall' | |
Private Member Functions | |
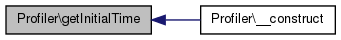
| getInitialTime () | |
Static Private Attributes | |
| static | $__instance = null |
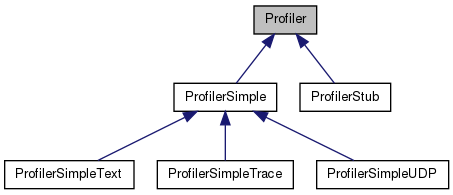
Detailed Description
- Todo:
- document
Definition at line 36 of file Profiler.php.
Constructor & Destructor Documentation
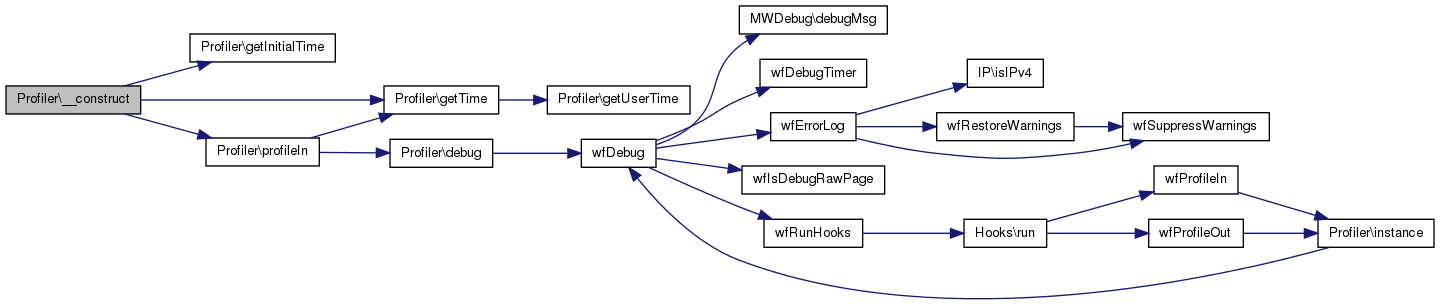
| Profiler::__construct | ( | $ | params | ) |
Reimplemented in ProfilerSimpleText, ProfilerSimple, and ProfilerSimpleTrace.
Definition at line 43 of file Profiler.php.
References getInitialTime(), getTime(), and profileIn().
Member Function Documentation
| static Profiler::calculateOverhead | ( | $ | profileCount | ) | [static, protected] |
Dummy calls to wfProfileIn/wfProfileOut to calculate its overhead.
Definition at line 404 of file Profiler.php.
References wfProfileIn(), and wfProfileOut().
Referenced by collateData().


| Profiler::calltreeCount | ( | $ | stack, |
| $ | start | ||
| ) |
Counts the number of profiled function calls sitting under the given point in the call graph.
Not the most efficient algo.
- Parameters:
-
$stack Array: $start Integer:
- Returns:
- Integer
- Access:
- private
Definition at line 422 of file Profiler.php.
References $count.
Referenced by collateData().

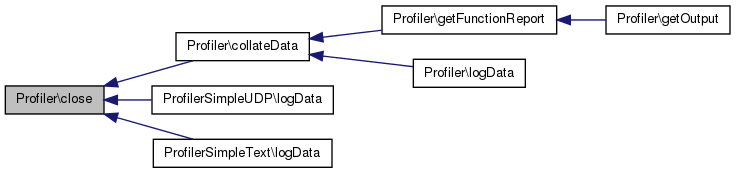
| Profiler::close | ( | ) |
Close opened profiling sections.
Reimplemented in ProfilerStub.
Definition at line 171 of file Profiler.php.
References profileOut().
Referenced by collateData(), ProfilerSimpleUDP\logData(), and ProfilerSimpleText\logData().

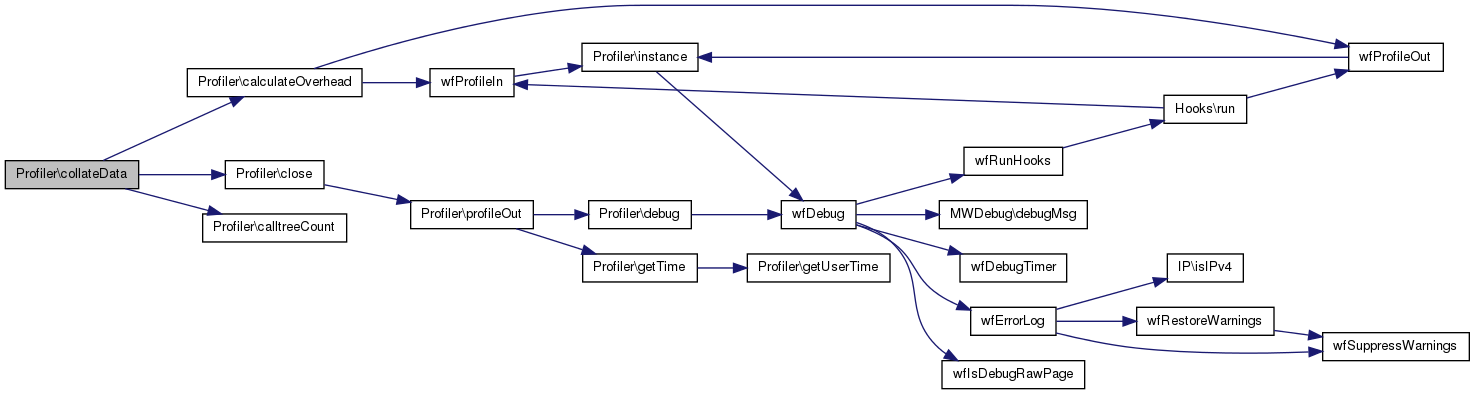
| Profiler::collateData | ( | ) | [protected] |
Definition at line 296 of file Profiler.php.
References $fname, calculateOverhead(), calltreeCount(), and close().
Referenced by getFunctionReport(), and logData().

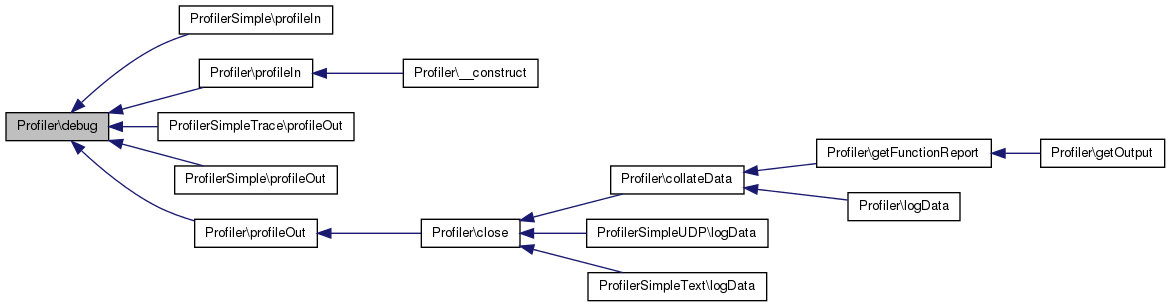
| Profiler::debug | ( | $ | s | ) |
Add an entry in the debug log file.
- Parameters:
-
$s String to output
Definition at line 508 of file Profiler.php.
References wfDebug().
Referenced by ProfilerSimple\profileIn(), profileIn(), ProfilerSimpleTrace\profileOut(), ProfilerSimple\profileOut(), and profileOut().

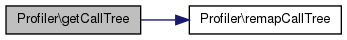
Returns a tree of function call instead of a list of functions.
Definition at line 209 of file Profiler.php.
References remapCallTree().
Referenced by getOutput().

| Profiler::getCallTreeLine | ( | $ | entry | ) |
Callback to get a formatted line for the call tree.
Definition at line 256 of file Profiler.php.
References $fname.
Get the function name of the current profiling section.
Reimplemented in ProfilerStub.
Definition at line 498 of file Profiler.php.
Returns a list of profiled functions.
- Returns:
- string
Reimplemented in ProfilerSimple.
Definition at line 378 of file Profiler.php.
References $fname, $total, and collateData().
Referenced by getOutput().

| Profiler::getInitialTime | ( | ) | [private] |
Definition at line 278 of file Profiler.php.
References $wgRequestTime.
Referenced by __construct().
Returns a profiling output to be stored in debug file.
- Returns:
- String
Reimplemented in ProfilerStub.
Definition at line 191 of file Profiler.php.
References $wgDebugFunctionEntry, $wgProfileCallTree, getCallTree(), and getFunctionReport().

Definition at line 109 of file Profiler.php.
References wfWikiID().
Referenced by ProfilerSimpleUDP\logData().


Definition at line 265 of file Profiler.php.
References getUserTime().
Referenced by __construct(), profileIn(), and profileOut().


Definition at line 273 of file Profiler.php.
Referenced by getTime().

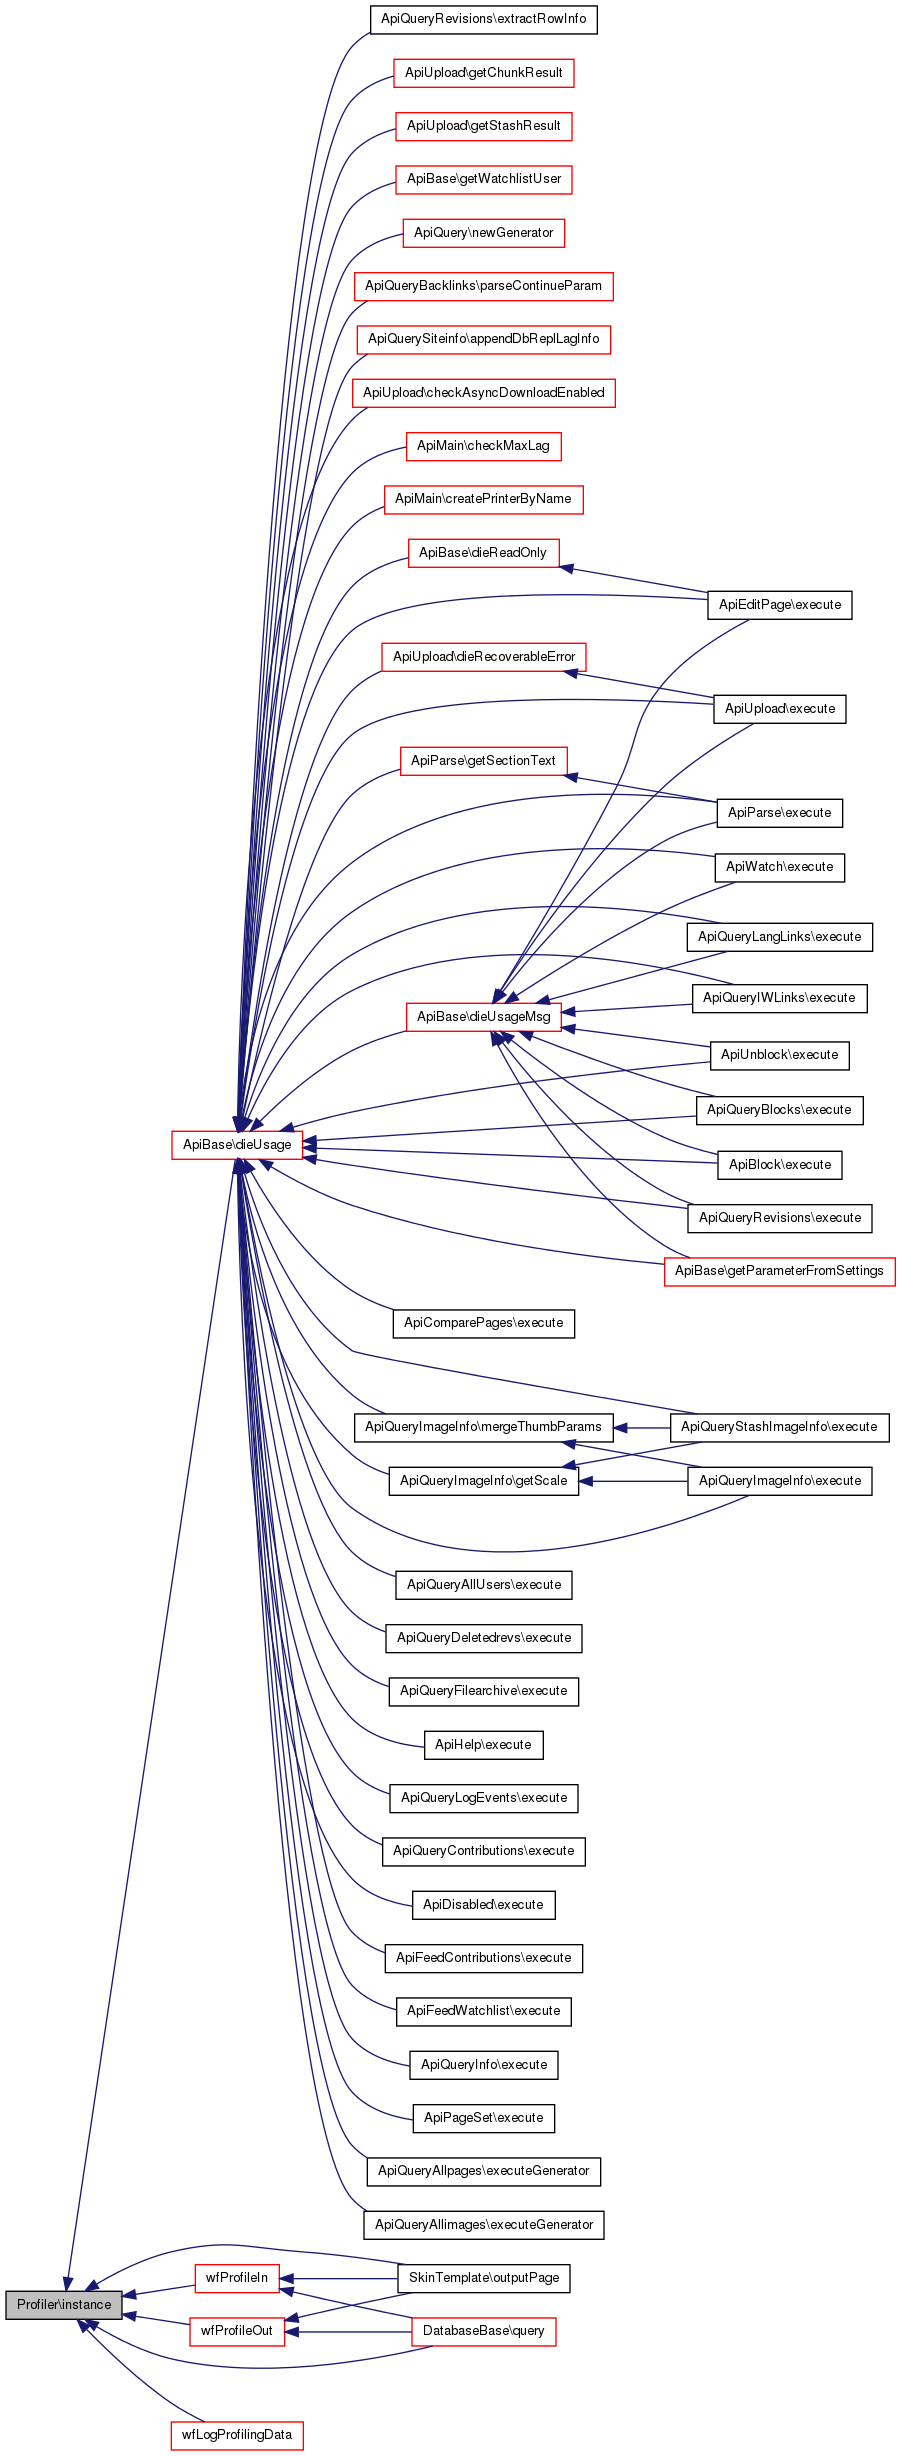
| static Profiler::instance | ( | ) | [static] |
Singleton.
- Returns:
- Profiler
Definition at line 65 of file Profiler.php.
References $__instance, and wfDebug().
Referenced by ApiBase\dieUsage(), SkinTemplate\outputPage(), DatabaseBase\query(), wfLogProfilingData(), wfProfileIn(), and wfProfileOut().

| Profiler::isStub | ( | ) |
Return whether this a stub profiler.
- Returns:
- Boolean
Reimplemented in ProfilerStub.
Definition at line 101 of file Profiler.php.
Log the whole profiling data into the database.
Reimplemented in ProfilerSimple, ProfilerSimpleTrace, ProfilerSimpleText, ProfilerStub, and ProfilerSimpleUDP.
Definition at line 434 of file Profiler.php.
References $wgProfilePerHost, $wgProfileToDatabase, collateData(), wfGetDB(), wfHostname(), and wfReadOnly().

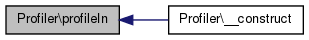
| Profiler::profileIn | ( | $ | functionname | ) |
Called by wfProfieIn()
- Parameters:
-
$functionname String
Reimplemented in ProfilerSimple, ProfilerSimpleTrace, and ProfilerStub.
Definition at line 122 of file Profiler.php.
References $wgDebugFunctionEntry, debug(), and getTime().
Referenced by __construct().

| Profiler::profileOut | ( | $ | functionname | ) |
Called by wfProfieOut()
- Parameters:
-
$functionname String
Reimplemented in ProfilerSimple, ProfilerSimpleTrace, and ProfilerStub.
Definition at line 136 of file Profiler.php.
References $wgDebugFunctionEntry, debug(), and getTime().
Referenced by close().

| Profiler::remapCallTree | ( | $ | stack | ) |
Recursive function the format the current profiling array into a tree.
- Parameters:
-
$stack profiling array
Definition at line 218 of file Profiler.php.
References $output.
Referenced by getCallTree().

| static Profiler::setInstance | ( | Profiler $ | p | ) | [static] |
Set the profiler to a specific profiler instance.
Mostly for dumpHTML
- Parameters:
-
$p Profiler object
Definition at line 92 of file Profiler.php.
| Profiler::setProfileID | ( | $ | id | ) |
Definition at line 105 of file Profiler.php.
| Profiler::setTemplated | ( | $ | t | ) |
Mark this call as templated or not.
- Parameters:
-
$t Boolean
Definition at line 182 of file Profiler.php.
References $t.
Member Data Documentation
Profiler::$__instance = null [static, private] |
Definition at line 41 of file Profiler.php.
Referenced by instance().
| Profiler::$mCalls = array () |
Definition at line 38 of file Profiler.php.
| Profiler::$mCollated = array () |
Definition at line 37 of file Profiler.php.
| Profiler::$mCollateDone = false |
Definition at line 40 of file Profiler.php.
Profiler::$mProfileID = false [protected] |
Definition at line 40 of file Profiler.php.
Profiler::$mStack = array() [protected] |
Definition at line 37 of file Profiler.php.
| Profiler::$mTemplated = false |
Definition at line 40 of file Profiler.php.
Profiler::$mTimeMetric = 'wall' [protected] |
Definition at line 39 of file Profiler.php.
| Profiler::$mTotals = array () |
Definition at line 38 of file Profiler.php.
| Profiler::$mWorkStack = array () |
Definition at line 37 of file Profiler.php.
The documentation for this class was generated from the following file:
- includes/profiler/Profiler.php