Entities can be defined at any place in the chart, not only at the beginning.
Entity names can contain upper or lowercase characters, numbers, dots and underscores. They are case sensitive and must start with a letter or underscore and cannot end in a dot. If you want other characters, you have to put the entity name between quotation marks every time it is mentioned. This, however, makes litte sense: you can set the label of the entity to influence how the entity is called on the drawn chart.
It is also possible to define entities without attributes (having all attributes set to default) by typing
entityname, ...;
It is also possible to change some of the attributes later in the chart, well after the definition of the entity. The syntax is the same as for definition — obviously the name identifies an already defined entity.
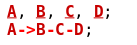
Note that typing several entity definition commands one after the other is the same as if all entity definitions were given on a single line. Thus
a;
b;
c;
is equivalent to
a, b, c;
Also, heading commands are combined with the definitions into a
single visual line of entity headings.
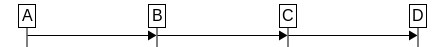
Entities are placed on the chart from left to right in the order of
definition. This can be influenced by the pos and
relative attributes.
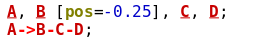
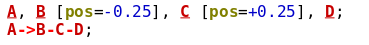
Specifying pos will place the entity left or right from its default
location. E.g., specifying pos=-0.25 for entity B makes B
to be 25% closer to its left neighbour. Thus pos shall be specified in
terms of the unit distance between entities. (Which is 130 points - a historic
value kept for backwards compatibility.)
The next entity C, however, will always be from a unit distance from the
entity defined just before it, so in order to specify a 25% larger space, on the
right side of entity B, one needs to specify pos=0.25 for
C.
 |
 |
 |
 |
 |
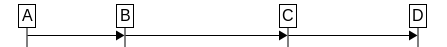 |
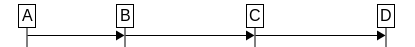
The attribute relative can be used to specify the base of the
pos attribute. Take the following input, for example.
In this case C will be placed halfway between A and
B.
 |
 |
Note that specifying the hscale=auto chart option makes entity
positining automatic. This setting overrides pos values with
the exception that it maintains the order of the entities that can be
influenced by setting their pos attribute. See Chart Options.
In most cases it is simpler to use hscale=auto, you need pos
only to fine-tune a chart, if automatic layout is not doing a good job.
A group entity can contain other entities. Groups can be nested arbitrary deep. To specify a group entity, use curly braces after an entity definition (but before the colon or comma). Between the braces you can list entity definitions, style/color definitions or chart options[17]. The curly braces open a new scope, so any style or color definition or chart option takes its effect only within the group of entities between the curly braces. See Scoping for more information.
Any entity you specify in the group must be a newly defined entity. It is not possible to place already defined entities into a group. Similar, an already defined entity cannot be made a group entity later by adding entities to it. Nor can a group be later extended with additional entities.
The position of a group entity is derived from its members so the ‘pos’ and
‘relative’ attributes cannot be used.
Group entities can be collapsed, by setting the ‘collapsed’ attribute
to yes (or via the GUI on Windows). A collapsed group entity does not
show its member entities, but is displayed as a non-grouped entity. Arrows and
boxes in the chart are modified (or even removed) to reflect the collapse.
If the ‘indicator’ attribute of the entity is set to yes, a small
indicator is shown both inside the collapsed entity and for each arrow or box
removed.
The following entity attributes can only be set at the definition of the entity.
labelThis specifies the text to be displayed for the entity. It can contain multiple lines or any text formatting character. See Text Formatting. If the label contains non alphanumeric characters, it must be quoted between double quotation marks. The default is the name of the entity.
posThis attribute takes a floating point number as value and defaults to zero. It specifies the relative horizontal offset from the entity specified by the
relativeattribute or by the default position of the entity. The value of 1 corresponds to the default distance between entities. See a previous section for an example. Grouped entities cannot have this attribute.relativeThis attribute takes the name of another entity and specifies the horizontal position used as a base for the
posattribute. Grouped entities cannot have this attribute.shapeThis attribute takes the name of the shape you want for the entity headings. See Entity Shapes.
shape.sizeThis attribute specifies the size of the shape to use for the entity headings. Only has effect if a valid shape is specified via the
shapeattribute. It takes one oftiny,small,normal,bigorhugewithsmallas default.collapsedThis attribute can be used to collapse a group entity. Only group entities can have this attribute.
indicatorIf set to yes (default) a small indicator will be displayed in a collapsed entity and also for any arcs that disappeared because of the collapse of this entity. On non-collapsed group entities it has no effect. Only grouped entities can have this attribute.
The following attributes can be changed at any location and have their effect downwards from that location.
showThis is a binary attribute, defaulting to yes. If set to no, the entity is not shown at all, including its vertical line. This is useful to omit certain entities from parts of the chart where their vertical line would just crowd the image visually. See more on entity headings in Entity Headings.
activeThis is a binary attribute, defaulting to no. If set the entity line becomes a thin long rectange indicating that the entity is active. You can set the fill of the rectangle via the ‘
vfill.*’ attributes. The commands ‘activate’ and ‘deactivate’ are shorthand for setting or clearing this attribute. Uisng the keywords is equivalent to setting the attributes, except that when the keywords are used just after an arrow, the activation/deactivation will take place immediately at the tip of the arrow, and not after.colorThis sets the color of the entity text, the box around the text and the vertical line to the same color. It is a shorthand to specify
text.color,line.colorandvline.colorto the same value.line.*,vline.*,fill.*,vfill.*,text.*,shadow.*See Common Attributes for the description of these attributes.
It is not required to explicitly define an entity before it is used.
Just typing the arrow definition a->b; will automatically
define entities ‘a’ and ‘b’ if not yet defined. This
behaviour can be disabled by specifying the --pedantic
command-line option or specifying pedantic=yes chart option.
See Chart Options. Disabling implicit
definition is useful to generate warnings for mis-typed entity names[18].
Implicitly defined entities always appear at the very top of the chart. If you want an entity to appear only later, define it explicitly.
By default, when an entity is defined, its heading is drawn at that location. If
the entity name is preceeded by the hide keyword or the show=no
attribute is specified at the entity definition then the entity heading is not
drawn at the location of the definition. It is drawn later, if/when the entity
is turned on by using show followed by the entity name or by setting
show=yes. Note that multiple entities can be listed after both
show and hide. It is also possible to specify other attributes for
entities after these keywords.
Mentioning an entity after its definition either preceeded by show or
with show=yes will cause
an entity heading to be drawn into the chart even if the entity is already shown.
This can be useful for long charts, see Defining Entities for examples.
You can display all of the entity headings using the heading; command, as
well. This command displays an entity heading for all (currently showing)
entities. This may be useful after a newpage; command, see Commands.
However, the best practice is to use ‘newpage [auto_heading=yes];’ instead,
since it only shows the heading when the chart is viewed per-page (which is the
same for page breaks inserted by automatic pagination).
The shape of an entity heading can be altered from the default box-like
appearance to something custom using the shape attribute. Its value
is a string, the name of the shape. The actual appearance of shapes is defined
in separate files. Msc-generator comes with a few default shapes (their name
all start with def.), but you can define your own shapes or add third-party
Defining Shapes. See Defining Shapes for more.
For some shapes, the label of the entity is written inside the shape, for some
it is written below. This is decided by the author of the shape. If the label is
written inside, it is scaled to fit. You can influence the size of the shape via the
shape.size attribute, which takes the values tiny, small,
normal, big or huge with small as default.
Note that the above two attributes can be set in the entity and
the entitygroup_collapsed style, which will influence all entities in a chart
at once.
[17] Only some of the chart options can be
used, the ones that merely change the context and do not draw. E.g. the
‘background’ options cannot be used. Practically only the ‘indicator’ chart
option makes any sense.
[18] To this end, color syntax highlighting underlines an entity name appearing the first time. This allows quickly realizing if the name of an entity is misspelled.