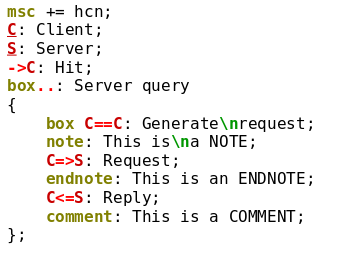
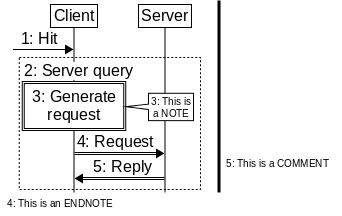
The ‘note’, ‘comment’ and ‘endnote’ commands enable you to make
annotations to the chart that are visible to the reader.
Notes are placed onto the chart drawing area in a callout;
comments are placed onto a column left or right from the
chart; whereas endnotes are placed at the bottom of the chart.
Notes are suitable for shorter comments, whereas the latter two
fit longer explanations better.
 |
 |
Each note, commend and endnote has a target element. The target element is the element
preceeding the ‘note’, ‘comment’ or ‘endnote’ command[23]. In case of notes the tip of the callout will point
to the target element, whereas side notes will be typeset beside their target.
You can issue multiple notes, comments and/or endnotes to the same target. If numbering is
enabled for a note, comment or endnote, it inherits the numbering of its target (if any).
The syntax is simple, issue one of the three commands with attributes. You must specify a label, but similar to arrows or entities, the colon syntax can be used.
note: This is a note [attributes];
note at <tip>: Note pointing to <tip> [attribute];
comment: Comment text [attributes];
endnote: Endnote text [attribuest];
Note and comment text is typeset in a smaller font by default.
You can change both of the above by changing the ‘note’, ‘comment’ or
‘comment’ styles.
For notes the tip of the callout can be guided using the at keyword. After it you can
spacify either an entity or a marker. This is useful if you want to make a note to a specific
part of an arrow.
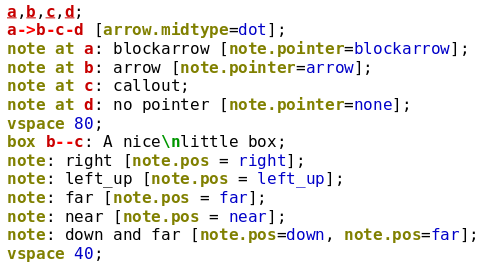
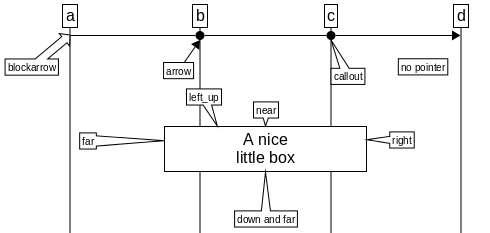
You can use the note.pointer attribute to define, what the tip looks
like. It can take four values: none, callout, arrow or
blockarrow.
The position of the note is selected automatically by Msc-generator, but you can
influence the choice via the note.pos attribute. It can take one of the
following values: near, far, left, right, up,
down, left_up, left_down, right_up or right_down. The
first two can be used to specify the distance from the element, whereas the rest
dictate which direction the note shall be. You can set this attribute twice if
needed, once for distance and a second time for direction.
The ‘note’ style contains text, fill and line attirbutes and also ‘note.layout’ and
‘note.pos’ to define default note layout.
Comments can be set either to the left or the right side of the chart as dictated by the
side attribute. This attribute can also take the value end, which will turn
the comment to an endnote. In fact endnotes are comments with their side attribute
set to end.
So you can convert all your comments to endnotes by
redefining the side attribute of the ‘comment’ style, as below.
For ease of use the comment.text and the comment.side chart options
can also be used to set comment properties[24].
defstyle note [text.size.normal=16, text.size.small=10];
defstyle comment [side=end];
comment.side=right;
comment.text.italics=yes;
When the chart contains comments on the side a line is drawn separating the comments
from the chart text. You can change the properties of this line via the
‘comment.line.*’ chart options. Only the width, color and type of the line
can be changed (not its radius or corner). You can turn this line off by
selecting the ‘none’ line type. Similar, the background of the comments can be set
via the ‘comment.fill.*’ chart options. These options can also be made part of designs.
Finally, the space available on the side for comments can be adjusted with the
hspace left|right comment command, see Spacing.