Principles
The NetKernel debugger operates at the level of the microkernel and can monitor each processed request.
The microkernel implements a small and efficient API that supports setting and revoking breakpoints
as well as viewing and releasing trapped requests.
Breakpoints are specified using a combination of information including a regular expression
for the requested URI.
The debugger application is a normal user-mode application.
Because of this certain precautions must be taken.
Antibreakpoints act as inhibitors to stop breakpoints getting
triggered at places that might effect critical user-side applications.
It may be important to include antibreakpoints for requests related to the debugger itself.
Debugging
Managing Breakpoints
You work with breakpoints in the main debugger window .
This window displays a list of established
breakpoints and provides the ability to add, delete or edit breakpoints.
The order of breakpoints and antibreakpoints has no impact on
debugging results.

Breakpoints
Each breakpoint defines a pattern which is checked by the microkernel
against all processed requests.
If a processed request is not already covered by an antibreakpoint then if it
matches the breakpoint pattern it will be stopped in the debugger
to allow for introspection.
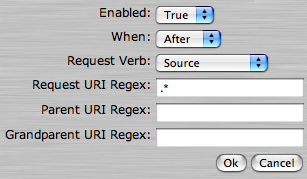
Pressing "edit" or "add breakpoint" will display the following page:

- Enabled - enabled breakpoints are used by the microkernel to match requests.
- When - the microkernel may stop a request before or after it has been processed.
Only requests stopped after processing will have a resource-representation in the result.
- Request Verb The request verb to match.
- Request URI Regex If not empty this regular expression must match the
rewritten URI of the request.
- Parent URI Regex If not empty this regular expression must match the
rewritten URI of the parent request of the current request.
- Grandparent URI Regex If not empty this regular expression must match the
rewritten URI of the grandparent request of the current request.
AntiBreakpoints
AntiBreakpoints inhibit any other breakpoints from operating.
They are defined as a regular expression on a root (transport initiated)
request URI.
If the expression matches then all sub-requests will be allowed to proceed.
The debugger automatically sets an antibreakpoint to prevent debugger, introspection or xlib
requests from triggering the debugger.
This antibreakpoint may be removed, however, it would then be possible for the debugger to
start debugging itself!
Pressing "edit" on an antibreakpoint or "add antibreakpoint" will display the following page:

The antiBreakpoint will only have an effect if it is enabled. The root URI regex is
a regular expression that must match the un-rewritten transport initiated request which
enters NetKernel.
Stopped Requests
When working with the debugger you may wish to take time to examine stopped requests.
Make sure that the deadlock period in the
Kernel Parameter Manager is set to a long enough
time period so that it will not terminate your trapped requests while you are studying them.
In addition, if you anticipate breakpointing many concurrent requests, you will want to
increase the throttle to a level that will allow you to control the system whilst
there are many other pending
requests.

Viewing of Resource
Clicking on the view link for a stopped request will request a detailed view of the
stopped request.
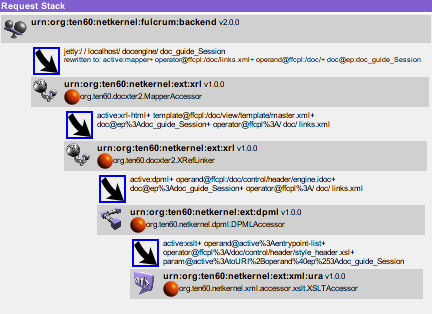
The left pane shows the request call stack starting with the fulcrum module that
initiated the original root request.
The call stack shows all sub-requests issued to satisfy the original root request.
Shown between the modules is the request that was issued symbolized with an arrow icon.

You may click on any sub-request to show the details of that request in the right pane.
Initially the right pane displays the deepest sub-request in the call stack.

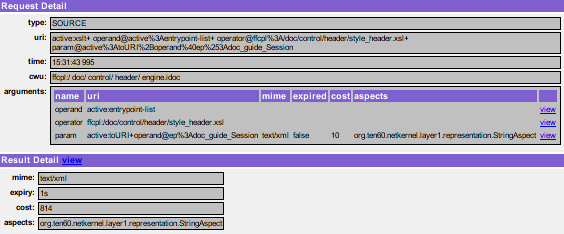
The request fields have the following meaning:
- type on of the five basic request verbs, SOURCE, SINK, NEW, DELETE, EXISTS, TRANSREPRESENT
- uri the un-rewritten request issued by the module
- time the time the request was issued
- cwu The current working URI for the request.
- arguments the list of all pass-by-value and pass-by-reference arguments. Pass-by-value
arguments can be identified by the additional displayed metadata. Aspects are the Java interfaces
that the resource representations exhibit.
The result fields have the following meaning:
- mime The mimetype of the result
- expiry The pessimistic expiry time of the resource in seconds, i.e.
the number of seconds from now that you can assume the resource is valid for without
re-requesting it
- cost The cumulative cost of obtaining this resource from the ground up
- aspects The Java interfaces that the resource representation exhibits.

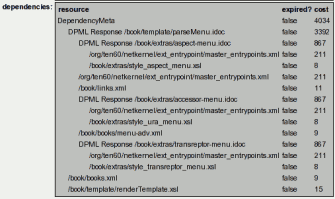
The dependencies table shows a hierarchical table of dependencies of the result. Each dependency
shows if it has expired and what its cost of creation is.
Performance
The evaluation of breakpoints has a very small effect on scheduler performance. If you
have finished using the debugger, certainly on a live system, ensure you have no breakpoints
(or antiBreakpoints) registered. If no breakpoints are registered the debugger has no performance penalty.
Example: Debugging a DPML Instruction
We will show how to debug a simple DPML program.
Suppose we have a resource ffcpl:/process.idoc containing a DPML program with one instruction:
<idoc>
<seq>
<instr>
<type>xslt</type>
<operand>this:param</operand>
<operator>ffcpl:/style.xsl</operator>
<target>this:response</target>
</instr>
</seq>
</idoc>
We can debug the xslt instruction by setting up a request breakpoint
active:xslt.*ffcpl:/style.xsl.*
This will break all xslt requests using the ffcpl:/style.xsl stylesheet.
However, if this stylesheet is used in many places, we may stop requests that were not initiated by
our DPML program.
To increase the specificity of our breakpoint, we can qualify it by adding a parent breakpoint match.
active:dpml.*ffcpl:/process.idoc.*
Now the debugger will only break on xslt requests that were initiated from the DPML ffcpl:/process.idoc.
You can add up to three layers of URI matches which can provide
high precision to the breakpoint.