You can start ObjectDevel either with WebStart, or you can download a release version of oscript, or build oscript from source code as described on the Development page.
For MacOS X, you can download a disk image (.dmg) file, which contains the
For other platforms, download the release tarball (.tar.gz). Once you have
uncompressed the release tarball, or built from source, you should have a
subdirectory
> java -jar ode.jar
NOTE 1: if you are using the editor and debugger as part of another application built using the chimera framework, rather than running the ObjectDevel in stand-alone mode, your instructions for starting the application may differ.
If this is the first time you have run the ObjectDevel, you may want to take a few moments to reposition windows to your liking, etc. You may also switch to "Window Mode" (menubar: Edit -> Mode), if you prefer a user interface where each window is a operating system managed window, rather than an internal window within one big "Desktop" window. Also, from the preferences window you can enabled or disable various add-on plugins, such as the fortune plugin (which, like the unix program fortune, displays a pithy quote at startup), or the pager plugin (which gives you multiple virtual workspaces, since you always need more screen space!). Any of these settings that you alter will be preserved for the next time you run.
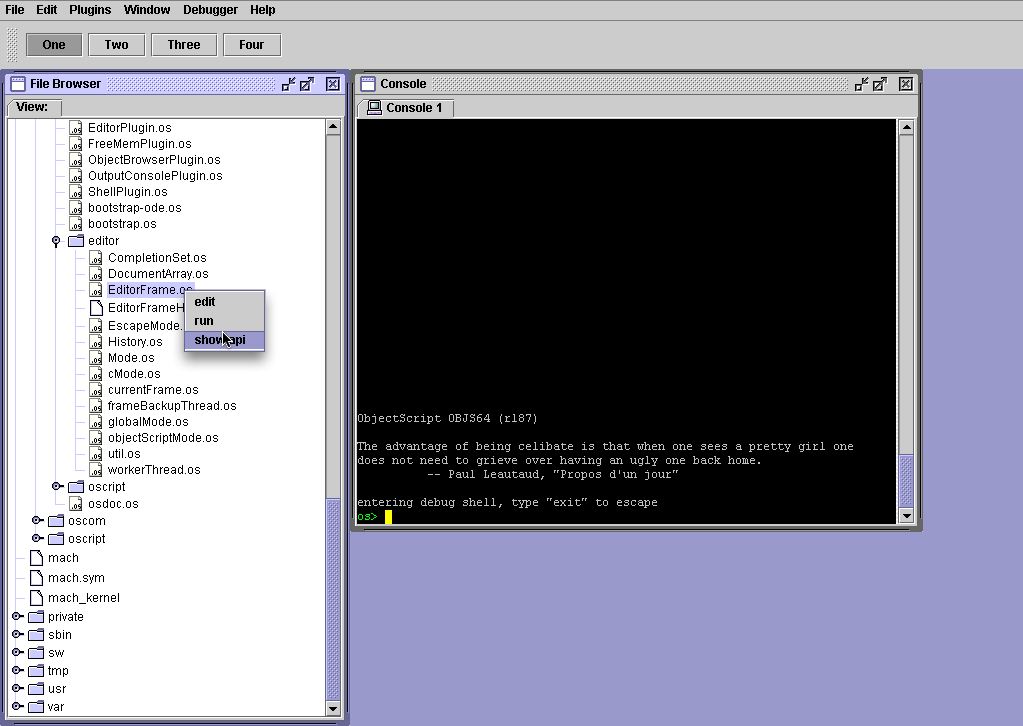
Once you start the application, you should see a file browser window, and a script console window:
If you don't see the file browser window, you can open it by selecting File -> Browse -> File System, from the menubar. You can use the file browser window to open the editor (by double clicking on a script file, or right-clicking and selecting edit), evaluate a script file (by right-clicking and selecting run), or browse the "javadoc" function comments (by selecting show api). You can also drag-and-drop a file from the browser window to a console window, or an editor window.
You can use the scripting console window to interactively try out any
script. To open additional consoles, select File -> New -> Console
from the menubar. Also, for the die-hard command-line-interface users,
there is a package (pkg.cl) of command-line-like functions,
such as ls(path):
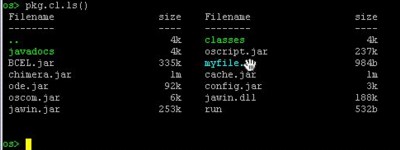
This function actually returns an array of files, so the return value
can be accessed like a regular array, but this array overrides the
castToString() method so that the array is displayed as
a nice formatted table.
Since the console can support hyperlinks, you can click on the name of
a script file in the output to launch the editor. Or, if you prefer,
you can use pkg.cl.edit(path) to launch the editor.
Also, if an exception is thrown while running some script code from a console window, you can click on a line in the backtrace to launch the editor or debugger:
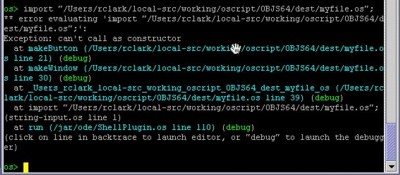
Clicking on the file-linenumber part of the backtrace will launch the editor and move the cursor to the specified line number. And clicking on the green "debug" will launch a debugger console window with a read-eval-print loop running from the scope of that function, so you can access variables that were in scope in the function corresponding to that line in the back trace, at that point when the exception was thrown.
Before going further, you will probably want to editot the script-path. The
script-path, like the unix environment variable $PATH is a set of
paths (although in this case it is a list, rather than a colon seperated string).
It is used by the scripting engine to resolve requests to import a
file, which means that in order to import a file, or to access it
through the package system, it will need to have a path specified relative to
an entry in the script-path. To add locations where the source files you are
working with are, bring up the script-path window by selecting from the menubar:
Edit -> Script Path.
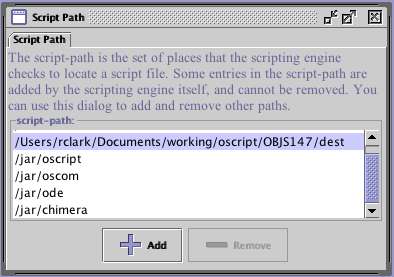
You will notice that script path entries created by the scripting engine itself show up in the script-path window, in addition to any entries you add yourself. But the Remove button is greyed out for these entries so you cannot remove them. (If you did remove one, it would likely cause many things to blow up in strange and creative ways, when all of a sudden files needed by the editor become no longer available.). To add an entry of your own, click Add, and select a path in the file chooser window:
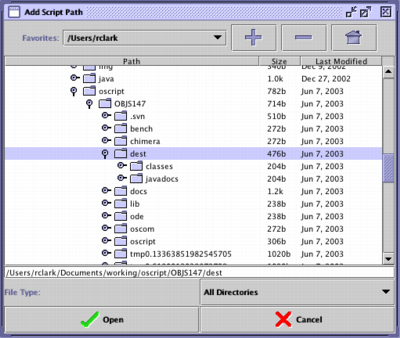
Entries created added to (or removed from) the script-path in this mannar will be preserved when you exit and restored when you restart the editor. Also, these paths are expanded in any file browser window.
To create a new script file, select File -> New -> Script File, from the menubar, or by right clicking on a directory in the file browser and choosing new file. To open an existing file, use the console or file browser as mentioned above.
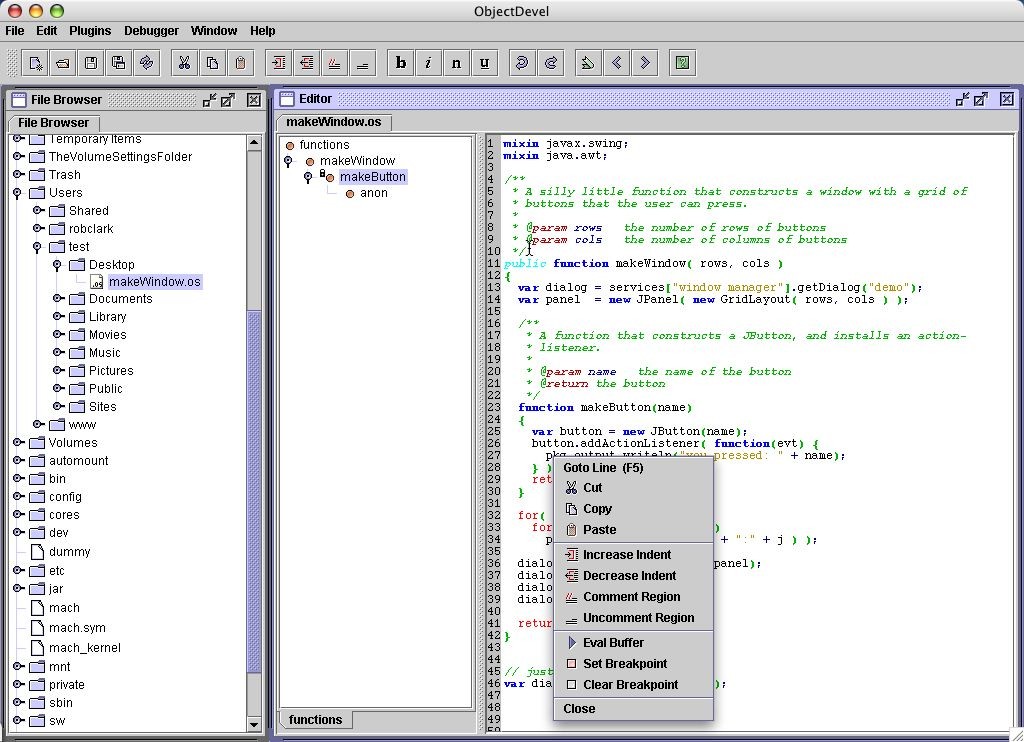
One the editor plugin starts, the editor toolbar will appear in the toolbar-area of the screen, to provide convenient access to frequently used features. Also, you can right-click (or click and hold) to access a popup menu which can be used to set and clear breakpoints, evaluate the current file, etc.
In the left hand side of the editor window is the function-tree, showing a tree view of all the functions in the file. This is handy for navigating large source files. Also, if the currsor is over a reference to some variable (or function), typing cntl-D will jump to the declaration of the variable, or cntl-< or cntl-> will jump to the previous/next reference to the same variable.
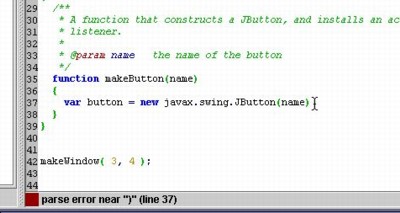
The editor continueously checks the syntax of the file as you edit, and will tell you where the syntax errors are, if any:
And the glyph-gutter will display an icon to show where breakpoints are set, and which line the program counter is on when stepping through code:
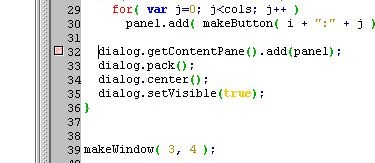
When you set a breakpoint, the debugger breakpoint window will appear, as will the debugger toolbar.
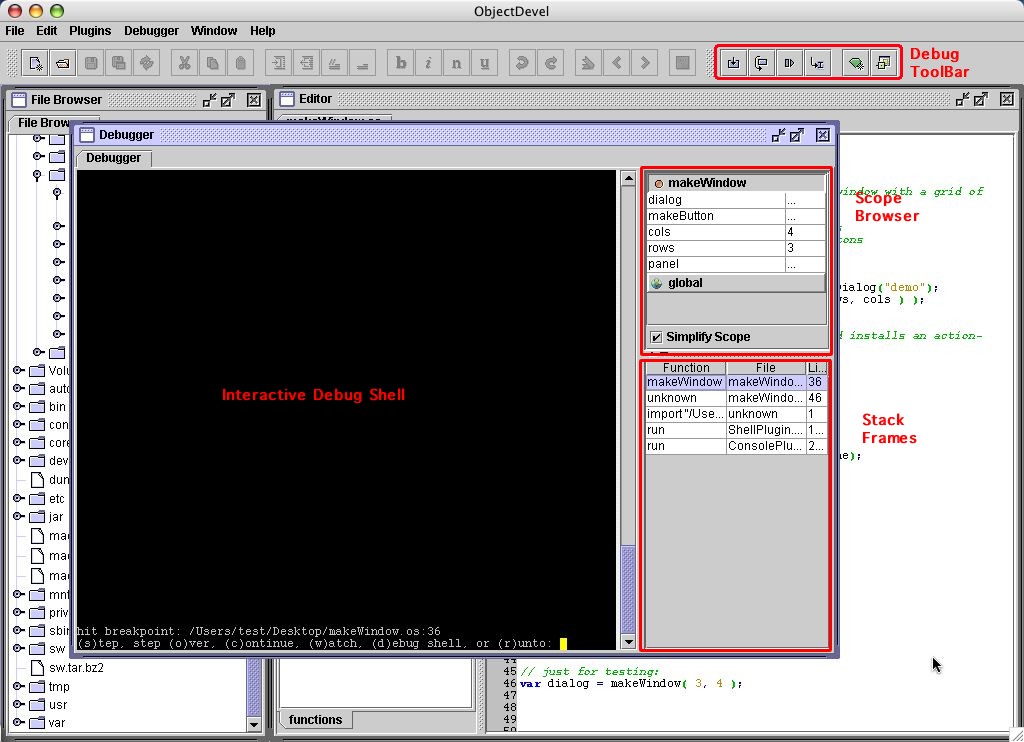
When the breakpoint is hit, the breakpoint
window will prompt you to (s)tep, step (o)ver, (c)ontinue, (w)atch,
(d)ebug shell, or (r)unto. (You can also use the debugger toolbar
buttons or the Debugger menubar menu.)
| Icon | Command | Short |
|---|---|---|
 |
step | s |
 |
step over | o |
 |
continue | c |
 |
runto | r |
 |
watch | w |
 |
debug shell | d |
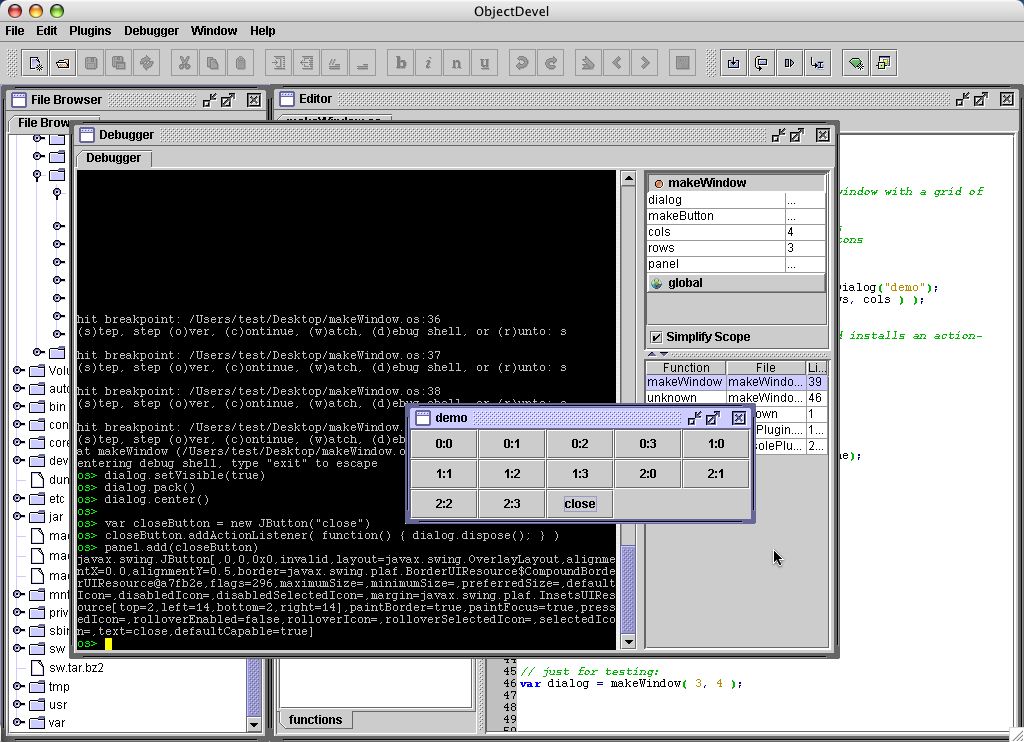
Stepping works like any other debugger, and will evaluate the next line. Step over works like step, except that it will step "over" a scope change, such as calling another function, or a loop body. Continue will continue evaluation. Watch will let you enter a watch expression, which is evaluated at every step, and it's result is printed to the breakpoint window. This can be used to watch the value of some variable as you step through code, and so on. The debug shell is a read-eval-print loop, like the script console, except that it is running in the scope of the currently selected stack frame from the call stack of the code being debugged. You can access the variables that are currently in scope.
In addition to the interactive debug session console, the debugger window lets you select which stack frame from the call stack to examine in the scope browser, which shows you the names and values of variables that are in scope.
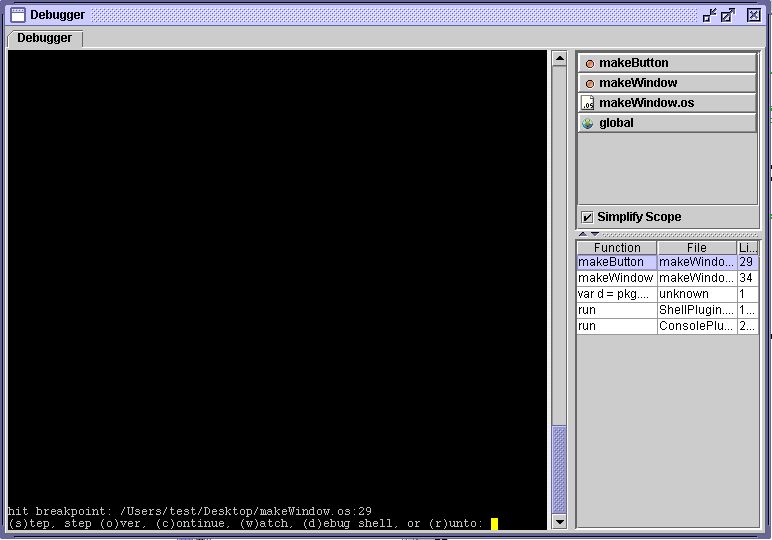
The scopes displayed in the scope browser are listed with the scope with the most precedence at the top, and global scope (with least precedence) at the bottom. Different kinds of scopes are identified with by icon:
| Icon | Type |
|---|---|
 |
function |
 |
object |
 |
file |
 |
global |
By default, the display is simplified, only showing the important scope types
(function, object, file, and global). Other minor scopes, such as created for
for loops or a block of code delimited with { }, are
folded into their parent scope. To see the entier scope chain, you can uncheck
the "Simplify Scope" checkbox.
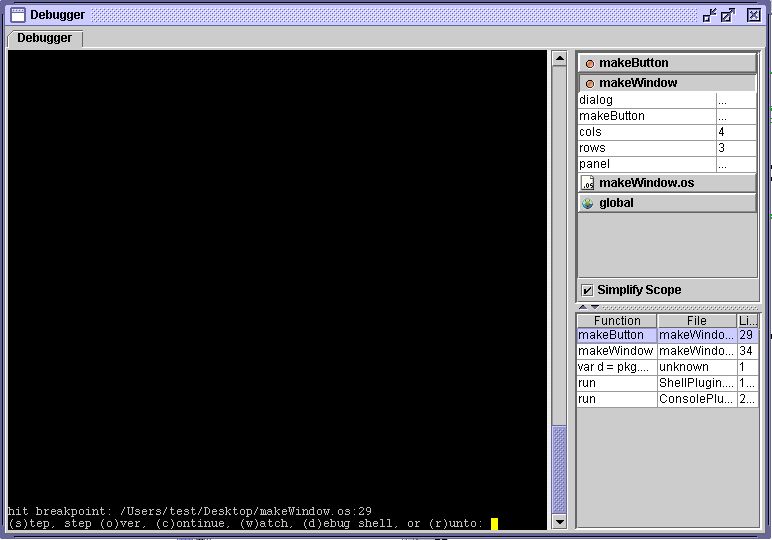
When you click on a scope in the scope browser, it will expand showing the names of the variables declared within the scope, and (depending on the type) the value of those variables.
To make it simpler to deploy a stand-alone ObjectScript application (or a mixed
java and ObjectScript application, that is started from script code), script
source files can be bundled up in to a runnable .jar file. This runnable jar
lists oscript.MainRunner as the main-class attribute in the jar's
manifest. This is a simple class that stores any command-line arguments in the
array args, and then tries to import
To create a runnable jar, select (from the menubar) File -> New -> Script
Application. You will be prompted to select a .jar file to save this new
application to. ObjectDevel will create the new jar, setup the manifest, and
then mount the new jar under
The editor itself is written in ObjectScript, and is designed to be extensible by
overriding existing key bindings, or adding new key bindings. Every key action,
including just typing a regular alphanumeric character has a key binding. Management
of key bindings is done through modes, for example the mode when editing an ObjectScript
source file is os-mode (pkg.editor.osMode). Modes can inherit bindings
from a parent mode, for example the parent mode of os-mode is c-mode
(pkg.editor.cMode). (The intention being that eventually someone will
add support for other languages, such as java, etc.)
// this file saved as my-key-bindings.os

pkg.editor.cMode.addKeyFxn(
  "ctrl shift 8",
  "insert-comment-divider",
  "if in a multiline comment, insert * characters out to column 80",
  function(evt) {

    if( pkg.cMode.inMultiLineComment() )
    {
      var buf = pkg.editor.EditorFrame.getCurrentFrame().getBuffer(); // -> JTextComponent
      var off = buf.getCaretPosition();

      var col = off - swing.text.Utilities.getRowStart( buf, off );
      var str = "";
      while( ++col < 80 )
        str += "*";

      buf.replaceSelection(str);
    }

  }
);
This example registers a key binding for "ctrl-*". Notice that a description of the
key binding can be provided when registering. This is used in the dynamically generated
help page, to ensure the help page is always up to date with the current registered key
bindings. The handler function can use pkg.editor.EditorFrame.getCurrentFrame()
to access the current editor frame object, and frame.getBuffer() to access
the frame's JTextComponent.