Table of Contents
Openlaszlo provides a powerful debugger which you can use either embedded in the application or as a separate ("remote") process. In addition, when you are compiling applications for deployment to DHTML, you may benefit from using tools for debugging in that environment.
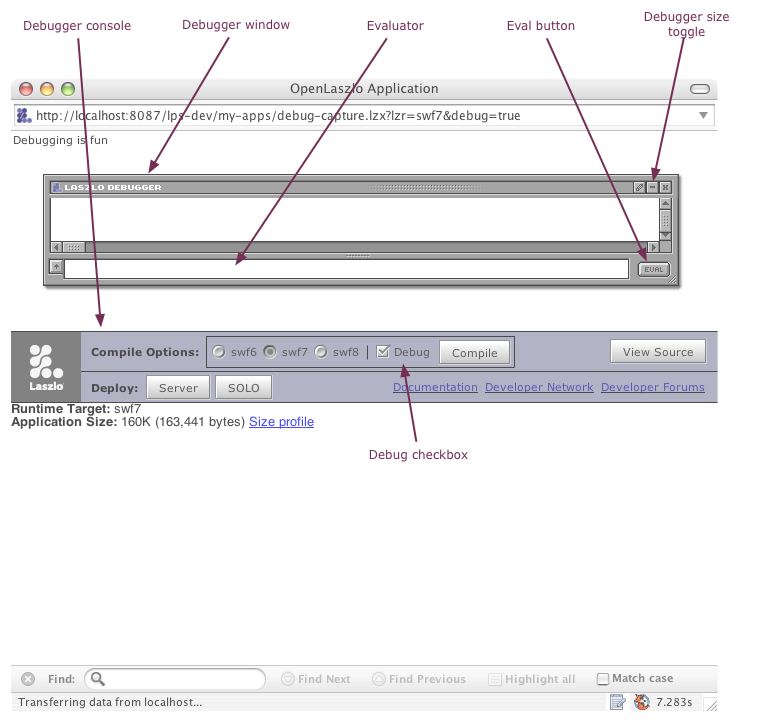
When you run an application with debugging enabled, the application is compiled with instrumentation to detect runtime errors, and the debugger window appears within the application canvas. The debugger provides these features:
-
The top portion of the debug window displays a scrolling list of debug messages. These include warning messages that the OpenLaszlo Runtime Library displays, as well as the arguments to calls to the
Debug.write(). -
The command-line portion of the debug window can be used to evaluate JavaScript statements and expressions within the context of the running application. Use this to inspect the program state, to test the behavior of functions and methods on various arguments, and to explore the LZX API.
-
Warnings for runtime errors such as undefined variables and functions are detected, and printed to the debug console.
Debugging may cause the application to run more slowly, even if the debugger window is not visible.
There are three ways to turn on the debugger in your application:
- The
debugattribute -
The debugger is enabled on if the canvas
debugattribute is set to true: - The "Debug" button
-
Press the "Debug" button on the developer console to request a copy of the application with debugging enabled. This is equivalent to recompiling the application with the
debug="true". -
The
debugquery parameter -
Edit the URL that is used to request the application to include the
debug=truequery parameter. This is equivalent to pressing the "Debug" button in the developer console.See theSystem Administrator's Guide for more information about request types.
Enabling the debugger has two effects:
-
It includes the debugger visual component. This displays debug messages, and has a command line interface for evaluating JavaScript statements.
-
It compiles the application with additional instrumentation to perform runtime error checking. Certain classes of erroneous code (below) result in warnings that are logged to the debug window.
A program that is compiled with runtime error checking will contain code that checks for the following conditions:
Table 50.1. Runtime error checks
| Condition | Example | Notes |
|---|---|---|
| Reference to undefined variable | var w = canvs.width |
canvs is not defined. (There is a global
variable named canvas, instead.)
|
| Reference to undefined property | var w = canvas.widt[a] |
canvas does not have a widt property. (The name of the property is canvas.width.)
|
| Call to undefined method | LzBrowser.getVerson() |
LzBrowser.getVerson (with no "i") is not defined.
|
| Call to undefined function | var n = parseInteger("123") |
parseInteger is not defined. (There is a JavaScript function parseInt.)
|
| Call to non-function | var w = canvas.width() |
canvas.width is a Number,
not a Function.
|
|
[a] The debugger does not warn about undefined references if the subscript notation is used: |
||
Each runtime exception warning is printed once per line per program run, not once each time the exception is encountered. The following program will print one warning, not ten.
<canvas debug="true" height="150">
  <handler name="oninit"><![CDATA[
    for (var i = 0; i > 10; i ++) {
      canvas.width();
    }
  ]]></handler>
</canvas>
Turning on runtime error checking makes an application bigger and slower. You should only perform size and speed optimization on the non-debug version of a program. Nonetheless, you will frequently want to run the debug warning to see whether you have introduced any runtime errors.
The top portion of the debugger window is the debugger
log. Use Debug.write() to print to the debugger
log. This method is variadic: it takes any number of
arguments. The text representations of the arguments are printed
to the debugger log, separated by spaces.
Example 50.3. Logging to the debugger
<canvas debug="true" height="150">
  <script>
    Debug.write('user code');
  </script>
  <button onclick="Debug.write('click', getMouse('x'))"/>
</canvas>
Some object are inspectable. See Section 1.5, “Inspecting Objects” for more about the inspect feature of
the debugger. See Section 2.2, “Customizing Debug.write()” to see
how to customize the display of objects within the debugger.
The bottom portion of the debugger window is the
evaluator. This is a command-line interface for evaluating
JavaScript expressions and statements within the application. Enter a
JavaScript statement into this area and press the Enter key (in
single-line mode) or the Evaluate button (in multi-line mode) to
evaluate the statement within the application. If the statement is an
expression, its result (if the result is not undefined)
is printed to the debugger log. If it is a statement but not an
expression, it is executed for effect.
Examples of expressions are canvas.x,
1+2, and
LzBrowser.LoadURL('http://www.laszlosystems.com/',
                     '_blank')
. (The last expression returns the value
undefined, so the debugger does not print the expression
value in the debugger log.) An example of a non-expression statements
is for (int i = 0; i < 10; i++) Debug.write(i). This
is evaluated for effect, and the statement itself does not result in a
value, although each execution of the loop prints the value of
i to the debugger log.
The debugger can be used to define global variables. Use the
var keyword to define a new global variable. For
example, after evaluating var n=100, evaluating
n+1 will print the value 101.
![[Note]](images/note.png) |
Note |
|---|---|
|
The |
You can also use var to create new global functions.
var f = function (x) {return x+1} creates a new function
named f, which can be used in subsequent
expressions such as f(1).
Consider the following debugger evaluations. Notice that the second case is terminated with a semicolon; otherwise the expressions are identical:
lzx> function foo () { return 'Fu'; }
Function#0| foo
lzx> foo
WARNING: interactive-eval-2:-1: reference to undefined variable 'foo'
lzx> function foo () { return 'Fu'; };
lzx> foo
Function#2| foo
In the first case, a function named 'foo' is created, but it is not the value of the global `foo`. Instead the Debug evaluator returns a value which is that function object. In the second case, the evaluator does not return a value, and the global `foo` is defined to be the function. Why is that?
The answer is that the debugger evaluator will first try to evaluate what you type as an expression, and if that fails, it will try to evaluate it as a statement. The second form is clearly not an expression (think of what you type as having parentheses around it—the semi-colon forces the second form to be a statement list, with an empty second statement). This distinction, although subtle, is correct ECMAscript semantics. It is not whether you name a function or not that determines when a global definition will be made; rather, two things must be true:
-
the function must be named, and
-
the function declaration must occur in a statement context.
If the function declaration occurs in an expression context, all you have done is to create a named function object as the value of that expression, you have not defined that name as the function.
Therefore, if you ever wonder why when you define a function in the debugger it does not behave as you expect, take a clue from what the evaluator prints out: if it prints out a function object, all you did was create a function, not define a function. Add the semi-colon after your definition and you will define the function (and not see a value printed).
Within a debugger expression, _ refers to the value of
the previous expression. For example, after evaluating
canvas.width to display the width of the canvas, you can
evaluate the expression _/2 to display half this
width.
The debugger defines the following variables:
_-
The result of the previous expression with a non-undefined value.
__[two underscore characters])-
The result of the expression prior to the previous expression.
___[three underscore characters]-
The result of the expression prior to the
__expression.
Evaluating Debug.write(, where
object)object
An object's private properties are those whose names begin with $ or ___ (three underscore characters). These names are used by the compiler and by the OpenLaszlo Runtime Library implementation,
respectively, and are not part of the documented API for the object.
An inspectable object can be an OpenLaszlo Runtime Library object such as a
window or LzDataset, or a built-in JavaScript
object: for example, an array such as [1, 2, 3], or a
Object such as {a: 1, b: 2}.
The Debug.inspect() function also displays the object and
its properties. Evaluating Debug.inspect( is
equivalent to evaluating object)Debug.write( and
then clicking on the object's representation.
object)
|
Note |
|---|---|
|
|
 Debug.write('subviews:', canvas.subviews);
  </handler>
</canvas>
</handler>
</canvas>
Sometimes you may have computations that you need to make only when you're debugging an application. For example, you may include some time stamps in order to measure performance of certain sections of code.
The best practice here is to enclose any debug-only computations in
if ($debug) {
  ...
}
The compiler will omit those statements when you compile without debugging.
By default, the debugger comes up over the top left corner of your
application. You can change the basic properties of the debugger by
including the <debug>
tag in your app, like this:
<debug x="100" y="100" height="500"/>.
Note that this does not enable the debugger; it merely
configures its appearance when the debugger is enabled. You still
have use one of the methods in Section 1.1, “Enabling the Debugger” to enable debugging. The
effect of this is that you can leave the <debug> in
your program at all times (including in production code), and it will
only have an effect when debugging is enabled.
Debug.write() displays the printable representation of an object. Where possible, the representation of an object is what you would type to represent that object in a program.
This is the case for instances of Singleton types (types with only a single instance, e.g., Undefined and Null) and for instances of Atomic types (types whose members have only a single value, no properties; e.g., Boolean or Number). Instances of Strings are normally not presented in this fashion (i.e., they are not quoted), as usually they are either a message or formatting.
Instances of compound types (types with properties, e.g., Array and Object) and Strings that are longer than Debug.printLength are printed in inspectable format:
«type(length)#id|name»
where:
- type
-
is the type of the object, as computed by
Debug.__typeof(). You can customize this field by defining aString-valued property_dbg_typenameor a method yielding aStringof the same name on your class - length
-
is the length of the object, if it is of a type that has a length, such as
ArrayorString - id
-
is a unique identifier that can be used to visually distinguish objects whose printed representation may be the same but which are not in fact the same object
- name
-
is a descriptive name of the object, as computed by
Debug.__String(). You can customize this field by defining aString-valued property_dbg_nameor a method yielding aStringof the same name on your class
By default an object is described by its properties, a function by its name (if available).
In addtion to Debug.write, Debug.warn, Debug.info, Debug.format, there are utilities for determining client environment (Debug.versionInfo() and others)
-
Canvas.versionInfoString(), Debug.versionInfo() which can be very helpful to record for bug reports.
-
Debug.debug, Debug.info—like Debug.warn and Debug.error, but with different colors and tags that match many popular Ajax runtimes.
-
Debug.[write,format,debug,info,warn,error] all "Do What I Mean" for format string
Descriptions and Strings are abbreviated to the first
Debug.printLength characters. This property defaults to
1024. You can see all the properties of an abbreviated
object, or all of a string by inspecting it (but take care to check
the length of the object — it may take a very long time to
print if it is large).
When the debugger prints an object, if the type part of the description is enclosed in ?'s, it means that the object is potentially
corrupted. (Technically it means that object instanceof object.[[prototype]].constructor is not true.)
Messages can be written from an LZX application to the
server log through the use of the
debuglog=true query parameter and the Debug.log()
method.
See the System Administrator's Guide to Delpoying OpenLaszlo Applications for information about configuration and reading the server log.
The debugger has capabilities for formatting output according to control strings.
Debug.formatToString produces formatted output to a string, formatting its arguments according to the control string:
-
The standard
printfconversions are accepted, with the exception ofa,n, andp. -
e,f, andgconversions are accepted but equivalent tof. -
The
handllength modifiers are accepted but ignored. No errors are signalled for invalid format controls or insufficient arguments.
There is an additional format specifier w that formats the argument as if by Debug.__String with the 'pretty' option and creates a 'hotlink' so the object can be inspected. If alternate format is requested (#), w uses the full Debug.__String format used by Debug.write. w format obeys Debug.printLength, binding it to the maximum width, if specified in the control string.
When the debugger prints a string and Debug.printPretty is false, it will escape all the SingleEscapeCharacter's in the string (i.e., ' " \ b \f \n \r \t \v). For example:
Debug.format('%#w', 'This is a "test"\nS\bring') ->«string#6| "This is a \"test\"\nS\bring"»The %d, %u, %i, %o, and %x directives (and their capital variants) cast their arguments to the type Number before formatting them. The %s directive casts its argument to a String. There is no default precision for these format directives —they will print the fractional part of non-integers by default. If you require that they round to the nearest integer, you can use %.0d. If passed an argument that cannot be coerced to a Number, these format directives print `NaN` (Not a Number).
Warnings and Errors are 'inspectable'. If you click on them, you will inspect the warning or error object. If backtracing
is enabled, a backtrace will be one of the properties of the object that you can inspect. Inspecting the backtrace will reveal
the recorded stack frames which record: the function called, this and the arguments to the function.
Debug.monitor(who, what): Takes an object and property name
and will emit a 'monitor message' each time that property is
changed.
Debug.unmonitor(who, what): Turns that off.
A monitor message consists of a timestamp, the function that caused the change, the object and property, and the old and new values. E.g.:
    MONITOR: [69227.23] LzLoader.initializeRequestObj: «LoadMovie#0| __debugger.lzx (loaded)».valid: true -> true
    MONITOR: [69265.36] LzLoader.initializeRequestObj: «LoadMovie#0| __debugger.lzx (loaded)».loaded: true -> false
    MONITOR: [69317.96] LzLoader.initializeRequestObj: «LoadMovie#0| __debugger.lzx (loading)».loading: true -> false
    MONITOR: [69378.19] LzLoader.initializeRequestObj: «LoadMovie#0| __debugger.lzx (initialized)».timedout: false -> false
    MONITOR: [69436.51] LzLoadQueue.makeRequest: «LoadMovie#0| __debugger.lzx (initialized)».loading: false -> true
    MONITOR: [69702.58] LzLoader.returnData: «LoadMovie#0| __debugger.lzx (loading)».loaded: false -> true
The debugger provides methods that allow you to see interactions between parts of your application.
When you invoke the debug.trace()(), the debugger traces the named method of the object and prints a message to the Debug console each time it is called or returned
from. When called, the message includes a timestamp, the name of the function and the arguments it was called with. When returned
from, the message gives the name of the function and the value it returned (if any). If backtraces are enabled, inspecting
the message will reveal the call chain that caused the modification.
The configuration parameter compiler.debug.backtrace, when true, causes the compiler to instrument functions to maintain a call stack. You must recompile both the OpenLaszlo
Runtime Library and your program if you change the setting of this parameter. It defaults to false because there is significant
overhead introduced in enabling backtracing; in general it is only useful on small test cases.
The configuration parameter is set in the configuration file lps.config , as explained in the System Administrator's Guide.
To create your own backtrace at any time:
Debug.backtrace()
There is an optional argument that is the number of frames to skip in creating the backtrace.
If you print a backtrace using Debug.write, it may be abbreviated, but clicking on it will reveal the full backtrace.
Debugger warnings will automatically include a backtrace. A backtrace snapshot can created by Debug.backtrace(). A backtrace is a subclass of array, converting it to a string will create a trace from innermost to outermost call, inspecting it will reveal the actual function objects that make up the array.
To get the full backtrace out of a debugger warning, you need to use:
__LzDebug.ObjectForID(NN)
Where NN is the object ID of the backtrace object, and then click on the resulting object to see the full trace.
A running OpenLaszlo application allocates parts of available virtual memory to store objects. When these objects are no longer needed the memory should be released by the application in order to become once again available for other use. Sometimes unneeded memory is not properly released, in which case the application tends to slow down over time as less and less memory becomes available. This is "leaking memory." The OpenLaszlo debugger can help you find memory leaks.
Three methods on __LzDebug are used to find leaks:
You use them in that order. Typically, you will start up your program, run it for a bit until you think it has reached a
steady state. Then invoke __LzDebug.markObjects(). This runs in the background and will mark all the objects that are currently in use. When you see the output '''Trace
Done''' you can move on to the next step.
You exercise your application in a way that you expect not to result in any retained storage (or some small amount of retained
storage). Run __LzDebug.findNewObjects(). This also runs in the background and will find any new objects that have been allocated since the markObjects call that have not yet been garbage-collected. When you see the output '''Trace Done''' you can move on to the next step.
Call __LzDebug.whyAlive(). This returns a ''leak list'', which you can call .toString() on to see ''<why> (<size>): <what>'' pairs. ''<why>'' is the shortest path from _root that is keeping the object from being collected; ''<size>'' is a count of the slots in that object and all its descendants,
which is a rough indication of the cost of the object; ''<what>'' is the debugger representation of the object. You may want
to set Debug.printLength to a larger value before converting to a string. You can also inspect the ''leak list'' to see the objects that have been
retained.
![[Warning]](../includes/warning.gif)
![[DHTML]](../includes/dhtml.gif)
DHTML only: The features described in this section only work in applications compiled to DHTML. They do not work in applications compiled to other runtimes.
For debugging the DHTML runtime, we recommend the FireBug extension to FireFox. If Firebug reports an error (with a little tiny red X in the bottom right hand corner of your firefox window) then there is probably a bug in your code or an OpenLaszlo bug. The errors reported by FireBug can be very obscure, but they usually happen when you are dereferencing a null pointer.
Firebug is more useful if you compile your DHTML application under debug mode (debug=true) so that method names show up in firebug stack traces. Dropping down the arrow next to an exception in firebug will show
a complete stack trace - often helpful for tracking down the root cause. Please file bugs with a stack trace if possible!
When you're compiling to DHTML, you generally use a two-step/two debugger process. It is always a good practice for you to have Firebug, because the OpenLaszlo debugger does not catch _all_ errors (it would be too much overhead to do so). We try to make our code debuggable in Firebug, as much as possible, but there are several limitations:
-
Firebug does not know about our class system, so it cannot display our objects as intelligently as our debugger, and
-
Firebud does not understand OpenLaszlo #file and #line declarations, so it cannot give as accurate error locations as our debugger does.
In DHTML, the debugger appears as a separate HTML frame, rather than
in-line in the application. As a consequence the <debug> tag does not actually control the size of the debugger frame.
The Flash runtime is permissive about dereferencing a null reference and getting properties on an undefined object. DHTML blows up if you do this. By "blows up" we mean that each DHTML browser crashes or hangs in a different way when the application code dereferences a null pointer. Lots of legacy code doesn't check for null.
In JavaScript you are allowed to ask for a non-existent slot, but not for a slot on something that is not an object.
Therefore, don't say foo.bar unless you know that foo is an object. If you know foo is either an object or null, you can say if (foo) before you say foo.bar. If you don't even know that, you would need to say if (foo instanceof Object).
Furthermore, in DHTML you cannot reference a non-existent variable. Therefore you should declare all your variables.
In SWF, you could get by without declaring them, and they would just appear to be `undefined`, in DHTML, it is an error to
refer to foo if you have not first said var foo.
If you are trying to make some legacy code work, you can ask if ('foo' in global) to see if foo had been declared, but that's sloppy. It's better to inspect your code to make sure that all variables are
initialized before they're referenced. Even if you're not planning to compile to DHTML, you should use the more conservative
style, as this will enhance maintainability and allow you to retarget for DHTML in the future if you decide to do so.