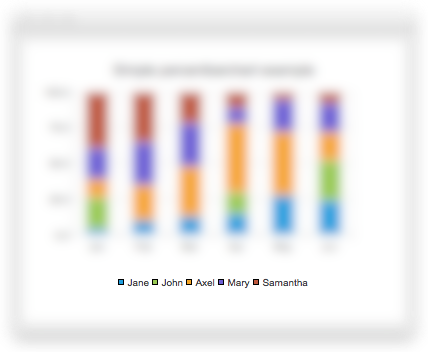
Legend QML Type
Displays the legend of a chart. More...
| Import Statement: | import QtCharts 2.2 |
| Instantiates: | QLegend |
Properties
- alignment : alignment
- backgroundVisible : bool
- borderColor : color
- color : color
- font : Font
- labelColor : color
- reverseMarkers : bool
- showToolTips : bool
- visible : bool
Detailed Description
A legend is a graphical object that displays the legend of a chart. The legend state is updated by the ChartView type when series change. The Legend type properties can be attached to the ChartView type. For example:
ChartView {
    legend.visible: true
    legend.alignment: Qt.AlignBottom
    // Add a few series...
}
Note: There is no QML API available for modifying legend markers. Markers can be modified by creating a custom legend, as illustrated by Qml Custom Example.
Property Documentation
alignment : alignment |
Defines how the legend is aligned with the chart. Can be Qt.AlignLeft, Qt.AlignRight, Qt.AlignBottom, or Qt.AlignTop. If you set more than one flag, the result is undefined.
Whether reverse order is used for the markers in the legend. This property is false by default.
Whether tooltips are shown when the text is truncated. This property is false by default. This property currently has no effect as there is no support for tooltips in QML.
Whether the legend is visible.
By default, this property is true.
See also QGraphicsObject::visible.
© 2017 The Qt Company Ltd. Documentation contributions included herein are the copyrights of their respective owners. The documentation provided herein is licensed under the terms of the GNU Free Documentation License version 1.3 as published by the Free Software Foundation. Qt and respective logos are trademarks of The Qt Company Ltd. in Finland and/or other countries worldwide. All other trademarks are property of their respective owners.
