
Qt Charts QML Types
The Qt Charts QML API is an intuitive and simple way to show charts in your QML applications.
Use the following QML to create a simple pie chart:
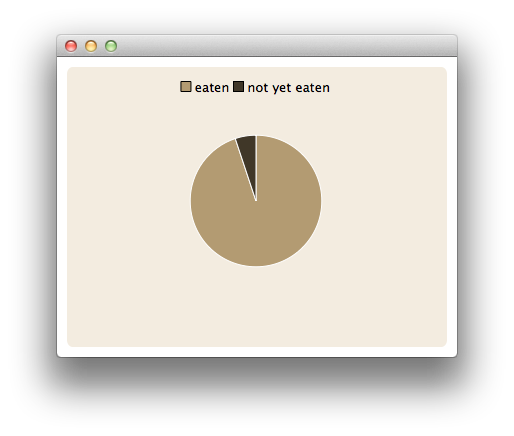
import QtQuick 2.0
import QtCharts 2.0

ChartView {
    width: 400
    height: 300
    theme: ChartView.ChartThemeBrownSand
    antialiasing: true

    PieSeries {
        id: pieSeries
        PieSlice { label: "eaten"; value: 94.9 }
        PieSlice { label: "not yet eaten"; value: 5.1 }
    }
}
Note: Since Qt Creator 3.0 the project created with Qt Quick Application wizard based on Qt Quick 2 template uses QGuiApplication by default. As Qt Charts utilizes Qt Graphics View Framework for drawing, QApplication must be used. The project created with the wizard is usable with Qt Charts after the QGuiApplication is replaced with QApplication.
QML Types
Presents data in area charts | |
Adds categories to a chart's axes | |
Places named ranges on the axis | |
Adds dates and times to a chart's axis | |
Adds a logarithmic scale to a chart's axis | |
A base type used for specialized axis types | |
Adds values to a chart's axes | |
Presents a series of data as horizontal bars grouped by category | |
Presents a series of categorized data as a percentage of each category | |
Presents a series of data as stacked horizontal bars, with one bar per category | |
An abstract parent type for all bar series types | |
Represents one set of bars in a bar chart | |
Horizontal model mapper for bar series | |
Vertical model mapper for bar series | |
Presents a series of data as vertical bars grouped by category | |
Presents a series of categorized data as a percentage of each category | |
Presents a series of data as vertically stacked bars, with one bar per category | |
Horizontal model mapper for box plot series | |
Vertical model mapper for box plot series | |
Represents a series of data as candlesticks | |
Represents a single candlestick item in a candlestick chart | |
Horizontal model mapper for a candlestick series | |
Vertical model mapper for a candlestick series | |
Displays the legend of a chart | |
Presents data in line charts | |
Horizontal model mapper for pie series | |
Type is used for making pie charts | |
Defines a slice in pie series | |
Vertical model mapper for pie series | |
Base type for all Qt Chart series types | |
Type is used for making scatter charts | |
Type is used for making spline charts | |
Horizontal model mapper for QXYSeries | |
Vertical model mapper for QXYSeries | |
Type is a base type for line, spline and scatter series | |
Presents data in box-and-whiskers charts | |
Represents one item in a box-and-whiskers chart | |
With CategoryRange you can define a range used by a CategoryAxis | |
Chart element | |
Type is used to define margins | |
Polar chart element | |
Type is used to initialize XY-series coordinate data |
© 2017 The Qt Company Ltd. Documentation contributions included herein are the copyrights of their respective owners. The documentation provided herein is licensed under the terms of the GNU Free Documentation License version 1.3 as published by the Free Software Foundation. Qt and respective logos are trademarks of The Qt Company Ltd. in Finland and/or other countries worldwide. All other trademarks are property of their respective owners.