
Analyzing Code
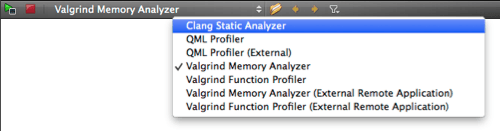
You can use the code analysis tools in the Analyze mode. To switch to Analyze mode, select Analyze in the mode selector, or select the Analyze menu and then select a tool. When you are in the Analyze mode, you can switch between tools by selecting them in the menu on the toolbar.
You can drag and drop the views in the Analyze mode to new positions on the screen. The size and position of views are saved for future sessions. Select Window > Views > Reset to Default Layout to reset the views to their original sizes and positions.
You can use the following code analysis tools in the Analyze mode:
- QML Profiler
You can inspect binding evaluations, signal handling, and painting operations when running QML code. This is useful for identifying potential bottlenecks, especially in the evaluation of bindings.
- Valgrind Code Analysis Tools
You can detect problems in memory management by using the Memcheck tool and find cache misses in the code by using the Callgrind tool.
- Clang Static Analyzer
You can detect problems in C, C++, and Objective-C programs by using the experimental plugin that integrates the Clang Static Analyzer source code analysis tool (commercial only).
© 2015 The Qt Company Ltd. Documentation contributions included herein are the copyrights of their respective owners. The documentation provided herein is licensed under the terms of the GNU Free Documentation License version 1.3 as published by the Free Software Foundation. Qt and respective logos are trademarks of The Qt Company Ltd in Finland and/or other countries worldwide. All other trademarks are property of their respective owners.