
User Interface
When you start Qt Creator, it opens to the Welcome mode, where you can:
- Open recent sessions and projects
- Create and open projects
- Open tutorials and example projects
- Read news from the online community and Qt labs
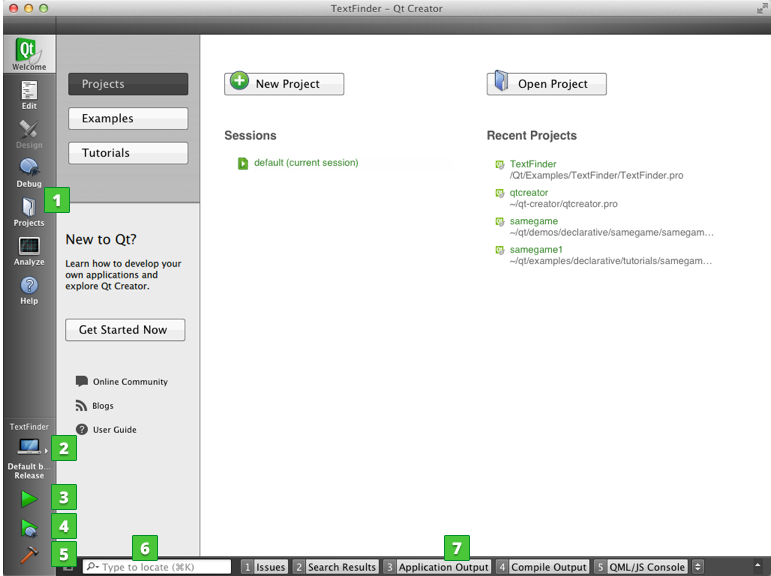
You can use the mode selector (1) to change to another Qt Creator mode.
You can use the kit selector (2) to select the kit for running (3), debugging (4), or building (5) the application. Output from these actions is displayed in the output panes (7).
You can use the locator (6) to to browse through projects, files, classes, functions, documentation, and file systems.
Modes
The mode selector allows you to quickly switch between tasks such as editing project and source files, designing application UIs, configuring how projects are built and executed, and debugging your applications. To change modes, click the icons, or use the corresponding keyboard shortcut.
To hide the mode selector and to save space on the display, select Window > Show Mode Selector.
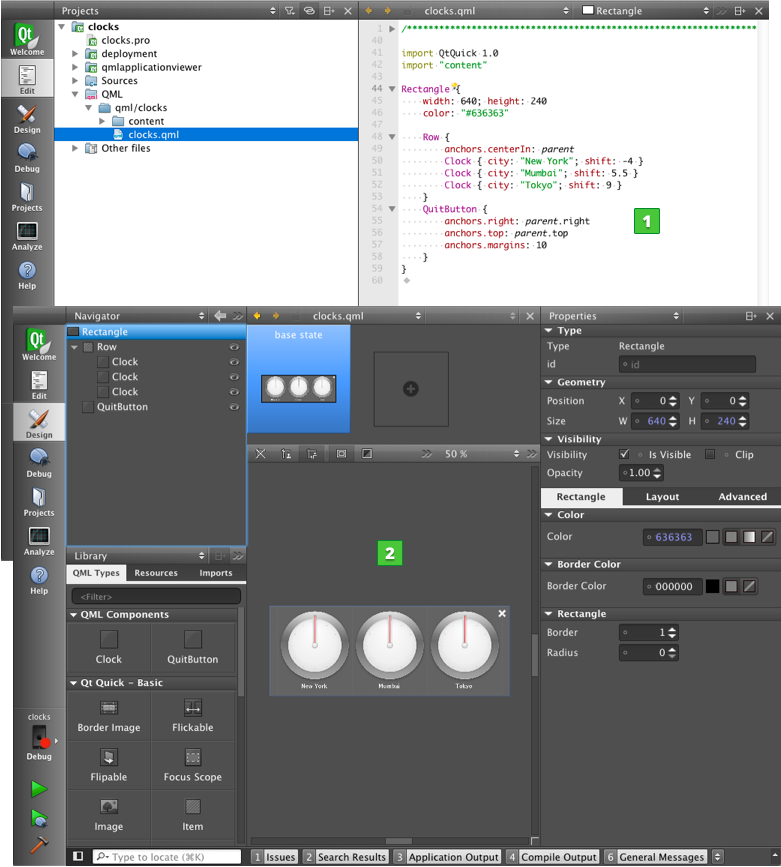
The following image displays an example application in Edit mode (1) and Design mode (2).
You can use Qt Creator in the following modes:
- Welcome mode for opening projects.
- Edit mode for editing project and source files.
- Design mode for designing and developing application user interfaces. This mode is available for UI files.
- Debug mode for inspecting the state of your application while debugging.
- Projects mode for configuring project building and execution. This mode is available when a project is open.
- Analyze mode for using code analysis tools to detect memory leaks and profile C++ or QML code.
- Help mode for viewing Qt documentation.
Certain actions in Qt Creator trigger a mode change. Clicking on Debug > Start Debugging > Start Debugging automatically switches to Debug mode.
Browsing Project Contents
The sidebar is available in the Edit and Debug modes, and with a different set of views in the Design mode. Use the sidebar to browse projects, files, and bookmarks, and to view the class hierarchy.
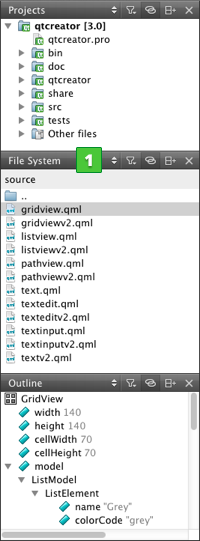
You can select the content of the sidebar in the sidebar menu (1):
- Projects shows a list of projects open in the current session.
- Open Documents shows currently open files.
- Bookmarks shows all bookmarks for the current session.
- File System shows all files in the currently selected directory.
- Class View shows the class hierarchy of the currently open projects.
- Outline shows the symbol hierarchy of a C++ file and the type hierarchy of a QML file.
- Type Hierarchy shows the base classes of a class.
- Include Hierarchy shows which files are included in the current file and which files include the current file.
For more information about the sidebar views that are only available in Qt Quick Designer, see Using Qt Quick Designer.
You can change the view of the sidebar in the following ways:
- To toggle the sidebar, click
 (Hide Sidebar/Show Sidebar) or press Alt+0 (Cmd+0 on OS X).
 - To split the sidebar, click
 (Split). Select new content to view in the split view.
 - To close a sidebar view, click
 (Close).
The additional options in each view are described in the following sections.
Viewing Project Files
The sidebar displays projects in a project tree. The project tree contains a list of all projects open in the current session. The files for each project are grouped according to their file type.
If the project is under version control, information from the version control system might be displayed in brackets after the project name. This is currently implemented for Git (the branch name or a tag is displayed) and ClearCase (the view name is displayed).
You can use the project tree in the following ways:
- To open files that belong to a project, double-click them in the project tree. Files open in the appropriate editor, according to the file type. For example, code source files open in the code editor and image files in the image viewer.
- To bring up a context menu containing the actions most commonly needed right-click an item in the project tree. For example, through the menu of the project root directory you can, among other actions, build, re-build, clean and run the project.
- To hide the categories and sort project files alphabetically, click
 (Filter Tree) and select Simplify Tree.
 - To hide source files which are automatically generated by the build system, select Filter Tree > Hide Generated Files.
- To keep the position in the project tree synchronized with the file currently opened in the editor, click
 (Synchronize with Editor).
 - To see the absolute path of a file, move the mouse pointer over the file name.
Files that are not sources or data can be still included into a project's distribution tarball by adding their paths to the DISTFILES variable in the .pro file. This way they also become known to Qt Creator, so that they are visible in the Projects view and are known to the locator and search.
Viewing the File System
If you cannot see a file in the Projects view, switch to the File System view, which shows all the files in the file system.
To also show hidden files, select Filter Files > Show Hidden Files.
To keep the position in the tree synchronized with the file opened in the editor, select Synchronize with Editor.
Viewing the Class Hierarchy
The Class View shows the class hierarchy of the currently open projects. To organize the view by subprojects, click  (Show Subprojects).
To visit all parts of a namespace, double-click on the namespace item multiple times.
Viewing QML Types
The Outline view shows the type hierarchy in a QML file.
- To see a complete list of all bindings, select Filter Tree > Show All Bindings.
- To keep the position in the view synchronized with the QML type selected in the editor, select Synchronize with Editor.
Viewing Type Hierarchy
To view the base classes of a class, right-click the class and select Open Type Hierarchy or press Ctrl+Shift+T.
Viewing Include Hierarchy
To view which files are included in the current file and which files include the current file, right-click in the editor and select Open Include Hierarchy or press Ctrl+Shift+I.
Viewing Output
The task pane in Qt Creator can display one of the following panes:
- Issues
- Search Results
- Application Output
- Compile Output
- QML/JS Console
- To-Do Entries
- Version Control
- General Messages
Output panes are available in all modes. Click the name of an output pane to open the pane. To maximize an open output pane, click the Maximize Output Pane button or press Alt+9.
To search within the Application Output and Compile Output panes, press Ctrl+F when the pane is active. Enter search criteria in the Find field and click the left and right arrows to search down and up in the pane.
To open the General Messages and Version Control panes, select Window > Output Panes. To display the To-Do Entries pane, enable the Todo plugin.
Issues
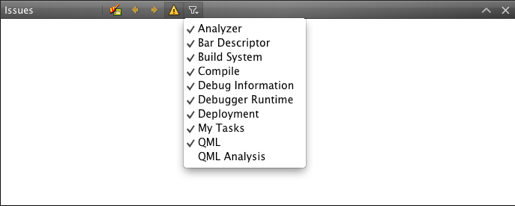
The Issues pane provides lists of following types of issues:
- Analyzer - Errors encountered while running the Valgrind code analysis tools.
- Bar Descriptor - Errors and warnings encountered when using the BlackBerry 10 BAR descriptor editor to customize the appearance and behavior of an application.
- Build System - Errors and warnings encountered during a build.
- Compile - Selected output from the compiler. Open the Compile Output pane for more detailed information.
- Debug Information - Lists debug information packages that might be missing.
- Debugger Runtime - Errors encountered when starting Qt Creator. For example, information about missing DLLs.
- Deployment - Errors encountered between building an application successfully and starting it on a device.
- My Tasks - Entries from a task list file (.tasks) generated by code scanning and analysis tools.
- QML - Errors in QML syntax.
- QML Analysis - Results of the JavaScript code syntax and validation checks
The pane filters out irrelevant output from the build tools and presents the issues in an organized way. To further filter the output by type, select Filter Tree and then select a filter.
Right-clicking on a line brings up a context menu with actions that you can apply to the contents of the line. You can remove a line, copy its contents to the clipboard, or search the Internet for a solution using the contents of the line as search criteria. In addition, you can show a version control annotation view of the line that causes the error message.
To navigate to the corresponding source code, click an issue or select Show in Editor in the context menu. The entry must contain the name of the file where the issue was found.
To view more information about an issue in the Compile Output pane, select Show Output in the context menu.
To jump from one issue to the next or previous one, press F6 and Shift+F6.
Search Results
In the Search Results pane, you can search through projects, files on a file system or the currently open file:
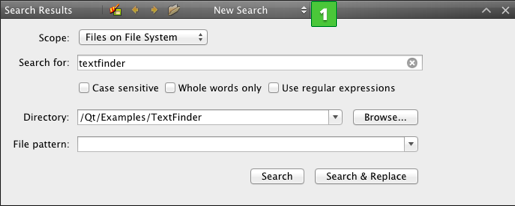
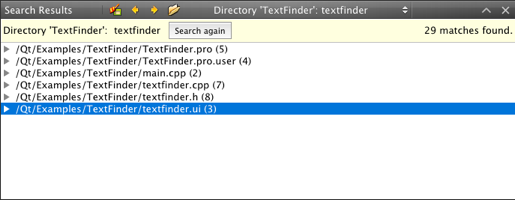
The search results are stored in the search history (1) from which you can select earlier searches.
The figure below shows an example search result for all occurrences of textfinder within the "/TextFinder" directory.
Application Output
The Application Output pane displays the status of a program when it is executed, and the debug output.
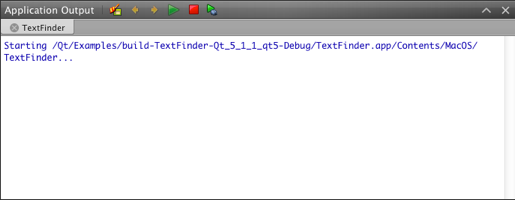
Select toolbar buttons to run applications, to attach the debugger to the running application, and to stop running or debugging.
Compile Output
The Compile Output pane provides all output from the compiler. The Compile Output is a more detailed version of information displayed in the Issues pane.
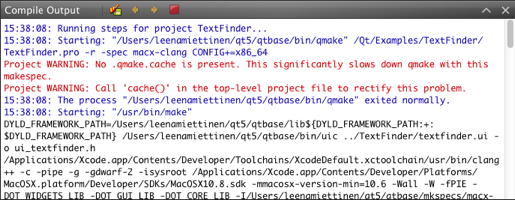
Double-click on a file name in an error message to open the file in the code editor.
Select the Cancel Build button to cancel the build.
QML/JS Console
In the QML/JS Console, you can type JavaScript expressions and use them to get information about the state of your application during debugging. You can change property values temporarily, without editing the source, and view the results in the running application.
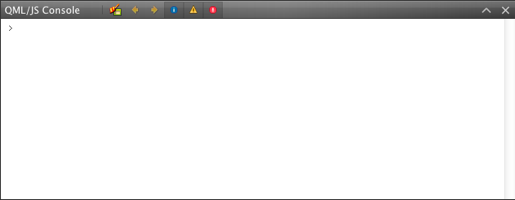
You can change the property values permanently in the code editor.
To-Do List
The To-Do List Entries pane lists the BUG, FIXME, NOTE, TODO, and WARNING keywords from the current file or from all project files. The keywords are organized into information, warning, and error categories.
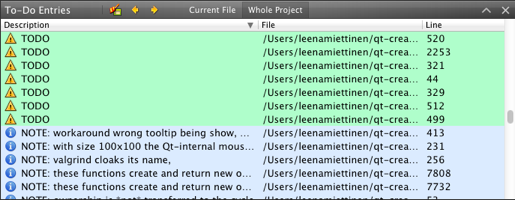
To add keywords, select Tools > Options > To-Do > Add. Set an icon and a line background color for the keyword. To change the icons and colors set for an existing keyword, select Edit.
To determine whether the keywords in the whole project or in the current file are displayed by default, select Scanning scope.
The Todo plugin is disabled by default. To enable the plugin, select Help > About Plugins > Utilities > Todo and restart Qt Creator.
In addition, you can open task list files generated by code scanning and analysis tools in the Issues pane. For more information, see Showing Task List Files in Issues Pane.
Changing Languages
Qt Creator has been localized into several languages. If the system language is one of the supported languages, it is automatically selected. To change the language, select Tools > Options > Environment and select a language in the Language field. The change takes effect after you restart Qt Creator.
Viewing Images
Qt Creator opens image files in the image viewer.
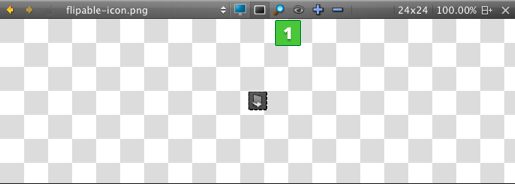
Use the toolbar buttons (1) or keyboard shortcuts to:
- Switch between background and outline modes
- Zoom in and out
- Fit images to screen
- Return to original size
- Play and pause animated GIF and MNG images
Navigating with Keyboard
Qt Creator caters not only to developers who are used to using the mouse, but also to developers who are more comfortable with the keyboard. A wide range of keyboard and navigation shortcuts are available to help speed up the process of developing your application.
Useful Features
For a list of useful Qt Creator features described in other parts of the documentation, see Tips and Tricks.
Platform Notes
Qt Creator uses standard names and locations for standard features, such as options or preferences. In this manual, the names and locations on Windows and Linux are usually used to keep the instructions short. Here are some places to check if you cannot find a function, dialog, or keyboard shortcut on OS X when following the instructions:
| For | Look In |
|---|---|
| Tools > Options | Qt Creator > Preferences |
| Help > About Plugins | Qt Creator > About Plugins |
| Keyboard shortcuts | Qt Creator > Preferences > Environment > Keyboard |
© 2015 The Qt Company Ltd. Documentation contributions included herein are the copyrights of their respective owners. The documentation provided herein is licensed under the terms of the GNU Free Documentation License version 1.3 as published by the Free Software Foundation. Qt and respective logos are trademarks of The Qt Company Ltd in Finland and/or other countries worldwide. All other trademarks are property of their respective owners.