
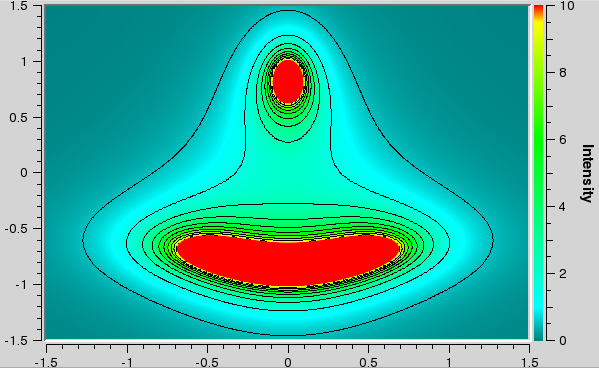
A spectrogram displays threedimenional data, where the 3rd dimension ( the intensity ) is displayed using colors. The colors are calculated from the values using a color map.
In ContourMode contour lines are painted for the contour levels.
Definition at line 35 of file qwt_plot_spectrogram.h.
Public Types | |
| enum | DisplayMode { ImageMode = 1, ContourMode = 2 } |
Public Member Functions | |
| QwtPlotSpectrogram (const QString &title=QString::null) | |
| virtual | ~QwtPlotSpectrogram () |
| void | setDisplayMode (DisplayMode, bool on=true) |
| bool | testDisplayMode (DisplayMode) const |
| void | setData (const QwtRasterData &data) |
| const QwtRasterData & | data () const |
| void | setColorMap (const QwtColorMap &) |
| const QwtColorMap & | colorMap () const |
| virtual QwtDoubleRect | boundingRect () const |
| virtual QSize | rasterHint (const QwtDoubleRect &) const |
| void | setDefaultContourPen (const QPen &) |
| QPen | defaultContourPen () const |
| virtual QPen | contourPen (double level) const |
| void | setConrecAttribute (QwtRasterData::ConrecAttribute, bool on) |
| bool | testConrecAttribute (QwtRasterData::ConrecAttribute) const |
| void | setContourLevels (const QwtValueList &) |
| QwtValueList | contourLevels () const |
| virtual int | rtti () const |
| virtual void | draw (QPainter *p, const QwtScaleMap &xMap, const QwtScaleMap &yMap, const QRect &rect) const |
Protected Member Functions | |
| virtual QImage | renderImage (const QwtScaleMap &xMap, const QwtScaleMap &yMap, const QwtDoubleRect &rect) const |
| virtual QSize | contourRasterSize (const QwtDoubleRect &, const QRect &) const |
| virtual QwtRasterData::ContourLines | renderContourLines (const QwtDoubleRect &rect, const QSize &raster) const |
| virtual void | drawContourLines (QPainter *p, const QwtScaleMap &xMap, const QwtScaleMap &yMap, const QwtRasterData::ContourLines &lines) const |
|
|
The display mode controls how the raster data will be represented.
When both modes are enabled the contour lines are painted on top of the spectrogram. The default setting enables ImageMode.
Definition at line 51 of file qwt_plot_spectrogram.h. |
|
|
Sets the following item attributes:
The z value is initialized by 8.0.
Definition at line 134 of file qwt_plot_spectrogram.cpp. References QwtPlotItem::setItemAttribute(), and QwtPlotItem::setZ(). |
|
|
Destructor.
Definition at line 146 of file qwt_plot_spectrogram.cpp. |
|
|
Reimplemented from QwtPlotItem. Definition at line 364 of file qwt_plot_spectrogram.cpp. Referenced by draw(). |
|
|
Definition at line 215 of file qwt_plot_spectrogram.cpp. Referenced by setColorMap(). |
|
|
Return the levels of the contour lines. The levels are sorted in increasing order.
Definition at line 331 of file qwt_plot_spectrogram.cpp. |
|
|
Calculate the pen for a contour line. The color of the pen is the color for level calculated by the color map
Definition at line 259 of file qwt_plot_spectrogram.cpp. Referenced by drawContourLines(). |
|
||||||||||||
|
Return the raster to be used by the CONREC contour algorithm. A larger size will improve the precisision of the CONREC algorithm, but will slow down the time that is needed to calculate the lines. The default implementation returns rect.size() / 2 bounded to data().rasterHint().
Definition at line 529 of file qwt_plot_spectrogram.cpp. References rasterHint(). Referenced by draw(). |
|
|
Definition at line 355 of file qwt_plot_spectrogram.cpp. Referenced by setData(). |
|
|
Definition at line 243 of file qwt_plot_spectrogram.cpp. Referenced by drawContourLines(). |
|
||||||||||||||||||||
|
Draw the spectrogram.
Reimplemented from QwtPlotRasterItem. Definition at line 615 of file qwt_plot_spectrogram.cpp. References boundingRect(), contourRasterSize(), QwtPlotRasterItem::draw(), drawContourLines(), QwtPlotItem::invTransform(), renderContourLines(), and QwtPlotItem::transform(). |
|
||||||||||||||||||||
|
Paint the contour lines
Definition at line 566 of file qwt_plot_spectrogram.cpp. References contourPen(), defaultContourPen(), QwtPainter::drawLine(), and QwtScaleMap::transform(). Referenced by draw(). |
|
|
Returns the recommended raster for a given rect. F.e the raster hint is used to limit the resolution of the image that is rendered.
Reimplemented from QwtPlotRasterItem. Definition at line 378 of file qwt_plot_spectrogram.cpp. Referenced by contourRasterSize(). |
|
||||||||||||
|
Calculate contour lines
Definition at line 549 of file qwt_plot_spectrogram.cpp. Referenced by draw(). |
|
||||||||||||||||
|
Render an image from the data and color map. The area is translated into a rect of the paint device. For each pixel of this rect the intensity is mapped into a color.
Implements QwtPlotRasterItem. Definition at line 400 of file qwt_plot_spectrogram.cpp. References QwtScaleMap::p1(), QwtScaleMap::p2(), QwtScaleMap::s1(), QwtScaleMap::s2(), QwtScaleMap::setPaintInterval(), QwtScaleMap::setScaleInterval(), and QwtPlotItem::transform(). |
|
|
Reimplemented from QwtPlotItem. Definition at line 152 of file qwt_plot_spectrogram.cpp. |
|
|
Change the color map Often it is useful to display the mapping between intensities and colors as an additional plot axis, showing a color bar.
Definition at line 202 of file qwt_plot_spectrogram.cpp. References colorMap(), QwtColorMap::copy(), QwtPlotRasterItem::invalidateCache(), and QwtPlotItem::itemChanged(). |
|
||||||||||||
|
Modify an attribute of the CONREC algorithm, used to calculate the contour lines.
Definition at line 276 of file qwt_plot_spectrogram.cpp. References QwtPlotItem::itemChanged(). |
|
|
Set the levels of the contour lines
Definition at line 313 of file qwt_plot_spectrogram.cpp. References QwtPlotItem::itemChanged(). |
|
|
Set the data to be displayed
Definition at line 342 of file qwt_plot_spectrogram.cpp. References QwtRasterData::copy(), data(), QwtPlotRasterItem::invalidateCache(), and QwtPlotItem::itemChanged(). |
|
|
Set the default pen for the contour lines. If the spectrogram has a valid default contour pen a contour line is painted using the default contour pen. Otherwise (pen.style() == Qt::NoPen) the pen is calculated for each contour level using contourPen().
Definition at line 230 of file qwt_plot_spectrogram.cpp. References QwtPlotItem::itemChanged(). |
|
||||||||||||
|
The display mode controls how the raster data will be represented.
Definition at line 167 of file qwt_plot_spectrogram.cpp. References QwtPlotItem::itemChanged(). |
|
|
Test an attribute of the CONREC algorithm, used to calculate the contour lines.
Definition at line 299 of file qwt_plot_spectrogram.cpp. |
|
|
The display mode controls how the raster data will be represented.
Definition at line 186 of file qwt_plot_spectrogram.cpp. |
 1.4.6
1.4.6