Chapter 20. Gathering System Information
Before you learn how to configure your system, you should learn how to gather essential system information. For example, you should know how to find the amount of free memory, the amount of available hard drive space, how your hard drive is partitioned, and what processes are running. This chapter discusses how to retrieve this type of information from your Red Hat Enterprise Linux system using simple commands and a few simple programs.
The ps ax command displays a list of current system processes, including processes owned by other users. To display the owner alongside each process, use the ps aux command. This list is a static list; in other words, it is a snapshot of what was running when you invoked the command. If you want a constantly updated list of running processes, use top as described below.
The ps output can be long. To prevent it from scrolling off the screen, you can pipe it through less:
ps aux | less
You can use the ps command in combination with the grep command to see if a process is running. For example, to determine if Emacs is running, use the following command:
ps ax | grep emacs
The top command displays currently running processes and important information about them including their memory and CPU usage. The list is both real-time and interactive. An example of output from the top command is provided as follows:
top - 18:11:48 up 1 min,  1 user,  load average: 0.68, 0.30, 0.11
Tasks: 122 total,   1 running, 121 sleeping,   0 stopped,   0 zombie
Cpu(s):  0.0%us,  0.5%sy,  0.0%ni, 93.4%id,  5.7%wa,  0.2%hi,  0.2%si,  0.0
Mem:    501924k total,   376496k used,   125428k free,    29664k buffers
Swap:  1015800k total,        0k used,  1015800k free,   189008k cached

  PID USER      PR  NI  VIRT  RES  SHR S %CPU %MEM    TIME+  COMMAND
 1601 root      40   0 20172 1084  920 S  0.3  0.2   0:00.08 hald-addon-sto
 1998 silas     40   0 14984 1160  880 R  0.3  0.2   0:00.13 top
    1 root      40   0 19160 1412 1156 S  0.0  0.3   0:00.96 init
    2 root      40   0     0    0    0 S  0.0  0.0   0:00.01 kthreadd
    3 root      RT   0     0    0    0 S  0.0  0.0   0:00.05 migration/0
    4 root      20   0     0    0    0 S  0.0  0.0   0:00.00 ksoftirqd/0
    5 root      RT   0     0    0    0 S  0.0  0.0   0:00.00 watchdog/0
    6 root      RT   0     0    0    0 S  0.0  0.0   0:00.04 migration/1
    7 root      20   0     0    0    0 S  0.0  0.0   0:00.00 ksoftirqd/1
    8 root      RT   0     0    0    0 S  0.0  0.0   0:00.00 watchdog/1
    9 root      20   0     0    0    0 S  0.0  0.0   0:00.00 events/0
   10 root      20   0     0    0    0 S  0.0  0.0   0:00.01 events/1
   11 root      20   0     0    0    0 S  0.0  0.0   0:00.00 cpuset
   12 root      20   0     0    0    0 S  0.0  0.0   0:00.00 khelper
[output truncated]
To exit top, press the q key.
Table 20.1. Interactive top commands
|
Command
|
Description
|
|---|
|
Space
|
Immediately refresh the display
|
|
h
|
Display a help screen
|
|
k
|
Kill a process. You are prompted for the process ID and the signal to send to it.
|
|
n
|
Change the number of processes displayed. You are prompted to enter the number.
|
|
u
|
Sort by user.
|
|
M
|
Sort by memory usage.
|
|
P
|
Sort by CPU usage.
|
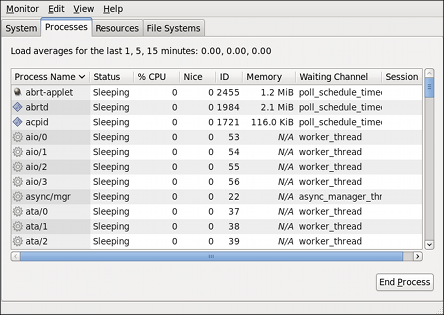
If you prefer a graphical interface for top, you can use the GNOME System Monitor. To start it from the desktop, select → → or execute gnome-system-monitor at a shell prompt. Select the Processes tab.
The GNOME System Monitor allows you to search for a process in the list of running processes. Using the GNOME System Monitor, you can also view all processes, your processes, or active processes.
The menu item allows you to:
Stop a process.
Continue or start a process.
End a processes.
Kill a process.
Change the priority of a selected process.
Edit the System Monitor preferences. These include changing the interval seconds to refresh the list and selecting process fields to display in the System Monitor window.
The menu item allows you to:
View only active processes.
View all processes.
View my processes.
View process dependencies.
View a memory map of a selected process.
View the files opened by the selected process.
Refresh the list of processes.
To stop a process, select it and click End Process. Alternatively you can also stop a process by selecting it, clicking on your menu and selecting .
To sort the information by a specific column, click on the name of the column. This sorts the information by the selected column in ascending order. Click on the name of the column again to toggle the sort between ascending and descending order.