Residuals Plot
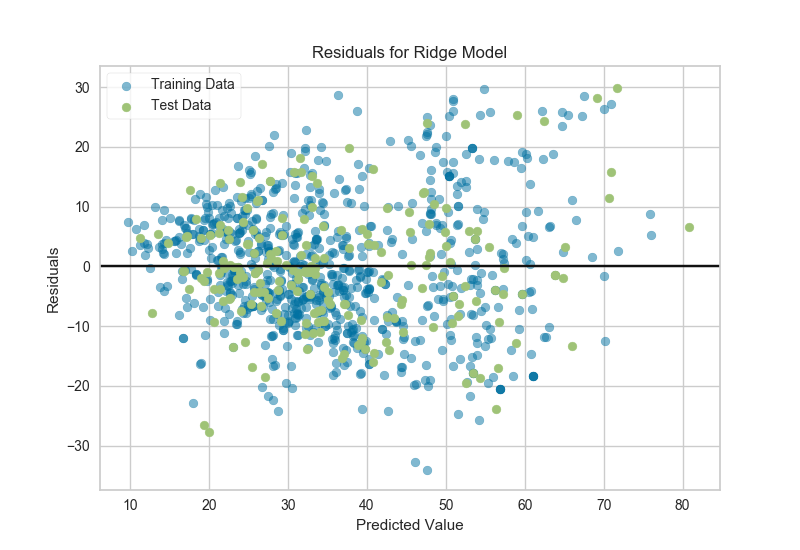
A residuals plot shows the residuals on the vertical axis and the independent variable on the horizontal axis. If the points are randomly dispersed around the horizontal axis, a linear regression model is appropriate for the data; otherwise, a non-linear model is more appropriate.
# Load the data
df = load_data('concrete')
feature_names = ['cement', 'slag', 'ash', 'water', 'splast', 'coarse', 'fine', 'age']
target_name = 'strength'

# Get the X and y data from the DataFrame
X = df[feature_names].as_matrix()
y = df[target_name].as_matrix()

# Create the train and test data
X_train, X_test, y_train, y_test = train_test_split(X, y, test_size=0.2)
# Instantiate the linear model and visualizer
ridge = Ridge()
visualizer = ResidualsPlot(ridge)

visualizer.fit(X_train, y_train)  # Fit the training data to the visualizer
visualizer.score(X_test, y_test)  # Evaluate the model on the test data
g = visualizer.poof()             # Draw/show/poof the data
API Reference
Regressor visualizers that score residuals: prediction vs. actual data.
-
class
yellowbrick.regressor.residuals.ResidualsPlot(model, ax=None, **kwargs)[source]¶ Bases:
yellowbrick.regressor.base.RegressionScoreVisualizerA residual plot shows the residuals on the vertical axis and the independent variable on the horizontal axis.
If the points are randomly dispersed around the horizontal axis, a linear regression model is appropriate for the data; otherwise, a non-linear model is more appropriate.
Parameters: model : a Scikit-Learn regressor
Should be an instance of a regressor, otherwise a will raise a YellowbrickTypeError exception on instantiation.
ax : matplotlib Axes, default: None
The axes to plot the figure on. If None is passed in the current axes will be used (or generated if required).
train_color : color, default: ‘b’
Residuals for training data are ploted with this color but also given an opacity of 0.5 to ensure that the test data residuals are more visible. Can be any matplotlib color.
test_color : color, default: ‘g’
Residuals for test data are plotted with this color. In order to create generalizable models, reserved test data residuals are of the most analytical interest, so these points are highlighted by hvaing full opacity. Can be any matplotlib color.
line_color : color, default: dark grey
Defines the color of the zero error line, can be any matplotlib color.
kwargs : dict
Keyword arguments that are passed to the base class and may influence the visualization as defined in other Visualizers.
Notes
ResidualsPlot is a ScoreVisualizer, meaning that it wraps a model and its primary entry point is the score() method.
Examples
>>> from yellowbrick.regressor import ResidualsPlot
>>> from sklearn.linear_model import Ridge
>>> model = ResidualsPlot(Ridge())
>>> model.fit(X_train, y_train)
>>> model.score(X_test, y_test)
>>> model.poof()
-
draw(y_pred, residuals, train=False, **kwargs)[source]¶ Parameters: y_pred : ndarray or Series of length n
An array or series of predicted target values
residuals : ndarray or Series of length n
An array or series of the difference between the predicted and the target values
train : boolean
If False, draw assumes that the residual points being plotted are from the test data; if True, draw assumes the residuals are the train data.
Returns
——
ax : the axis with the plotted figure
-
finalize(**kwargs)[source]¶ Finalize executes any subclass-specific axes finalization steps. The user calls poof and poof calls finalize.
Parameters: kwargs: generic keyword arguments.
-
fit(X, y=None, **kwargs)[source]¶ Parameters: X : ndarray or DataFrame of shape n x m
A matrix of n instances with m features
y : ndarray or Series of length n
An array or series of target values
kwargs: keyword arguments passed to Scikit-Learn API.
-
score(X, y=None, train=False, **kwargs)[source]¶ Generates predicted target values using the Scikit-Learn estimator.
Parameters: X : array-like
X (also X_test) are the dependent variables of test set to predict
y : array-like
y (also y_test) is the independent actual variables to score against
train : boolean
If False, score assumes that the residual points being plotted are from the test data; if True, score assumes the residuals are the train data.
Returns
——
ax : the axis with the plotted figure
-