Scilab 6.0.0
Scilab Help >> Graphics > Datatips > datatipSetDisplay
 The display function can also be used to place tip text in different locations:
datatipSetDisplay
Set the function used to compute the datatip string.
Syntax
datatipSetDisplay(handle,"fun")
datatipSetDisplay(handle, fun)
Arguments
- handle
A handle on a datatip or its parent.
- "fun"
A variable that contains a function (type==11 or type==13) or the name of this function. This function syntax must be
str=fun(h)wherehis the handle of the datatip.This function must return a string or a vector of strings in
str.
Description
Set the function used to format the text to be displayed at the datatip point. If the handle of the parent of the datatip is given as first argument, then all the datatips which don't have a display function will have same one.
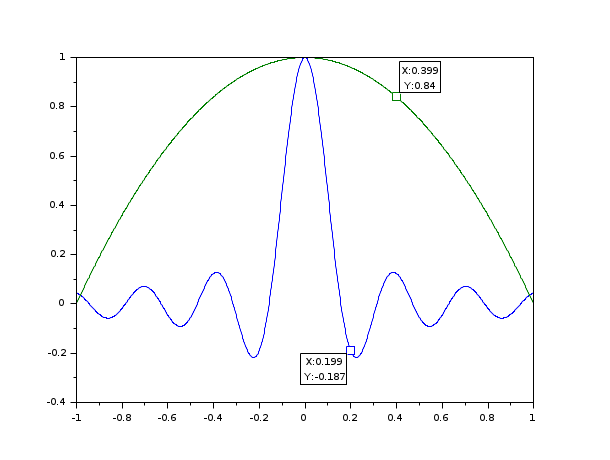
Examples
x=linspace(-1,1,1000);
clf()
plot(x,sinc(20*x),x,1-x.^2);
e=gce();e=e.children;
d21=datatipCreate(e(2),600);
d1=datatipCreate(e(1),700);

function str=mydisplay(h)
    pt = h.data;
    str=msprintf('sinc(%-0.2g)=%-0.2g', 20*pt(1),pt(2))
endfunction
datatipSetDisplay(d21,"mydisplay")
The display function can also be used to place tip text in different locations:
See Also
- datatips — Tool for placing and editing tips along the plotted curves.
- datatipSetOrientation — Set the position of the text box associated with the given tip.
Comments
Add a comment:
Please login to comment this page.