datatips
Tool for placing and editing tips along the plotted curves.
Description
With this tool, it is possible to place, move and modify tips on the curves (polylines). This can be done by program or interactively. The commonly used mode is the interactive one:
The datatips mode can be enabled by datatipToggle() or using the
Edit/Start datatip manager or clicking on the
toolbar icon
 of the desired graphic window.
Once enabled, a simple left click on a curve will add a tip ( a small box with information on the current point) at the interpolated point of the curve.
To move a tip, press left button on the small square mark on the curve and drag it to the desired location.
To remove a datatip, right click on the small square mark on the curve.
Examples
// this examples show how to manage tips by program
x1=linspace(0,1,100)';
y1=x1.^3;
clf();
plot(x1,y1,x1,sinc(10*x1));
e=gce();
p1=e.children(1);//sinc(10*x1)
p2=e.children(2); //x1^3
t=datatipCreate(p1,50);
datatipSetOrientation(t,"lower right")
t=datatipCreate(p1,[0.8 0.5]);
t=datatipCreate(p2,[0.1,0.0]);
t=datatipCreate(p2,[0.8 0.4]);
datatipSetOrientation(t,"upper left")

function str=myfmt(h)
pt = h.data;
str = msprintf('sinc\n%s', sci2exp(round(pt*10)/10))
endfunction
datatipSetDisplay(t,"myfmt")

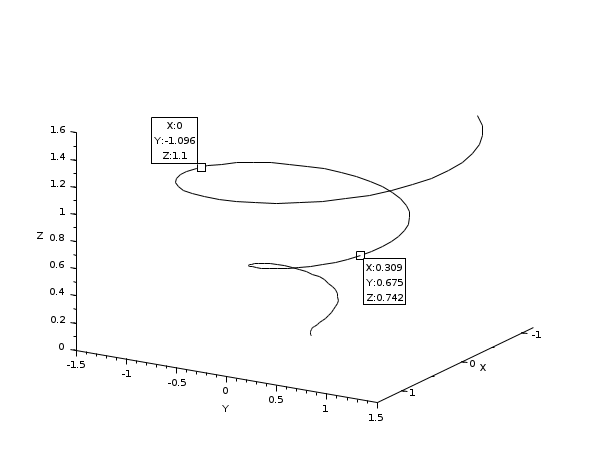
// With 3D curves
x1=linspace(0,1.5,100)';
y1=x1.^3;
clf();
param3d(x1.*cos(10*x1),x1.*sin(10*x1),x1);
ax=gca();ax.box='off';
ax.rotation_angles=[76 31];
p=gce();
t=datatipCreate(p,50);
datatipSetOrientation(t,"lower right")
datatipCreate(p,[0,-1.10,1.10]);
See Also
- datatipToggle — toggles the data tips mode.
- datatipCreate — Create a datatip on a polyline by program
- datatipMove — Move a specified datatip using the mouse.
- datatipSetDisplay — Set the function used to compute the datatip string.
Comments
Add a comment:
Please login to comment this page.