Scilab 6.0.0
Scilab Help >> Graphics > 3d_plot > fplot3d
fplot3d
3D plot of a surface defined by a function
Syntax
fplot3d(xr,yr,f,[theta,alpha,leg,flag,ebox])
fplot3d(xr,yr,f,<opt_args>)
Arguments
- xr
row vector of size n1.
- yr
row vector of size n2.
- f
external of type z=f(x,y).
- theta,alpha,leg,flag,ebox
see
plot3d.- <opt_args>
see
plot3d.
Description
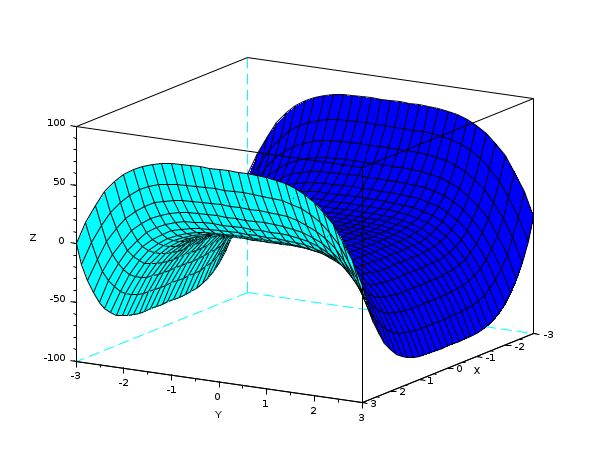
fplot3d plots a surface defined by the external function
f on the grid defined by xr and
yr.
Enter the command fplot3d() to see a demo.
See Also
- plot3d — 3D plot of a surface
Comments
Add a comment:
Please login to comment this page.