hist3d
3D representation of a histogram
Syntax
hist3d(mtx,[theta,alpha,leg,flag,ebox])
hist3d(mtx,<opt_args>)
hist3d(list(mtx,x,y),[theta,alpha,leg,flag,ebox])
hist3d(list(mtx,x,y),<opt_args>)
Arguments
- mtx
matrix of size (m,n) defining the histogram
mtx(i,j)=F(x(i),y(j)), wherexandyare taken as0:mand0:n.- list(mtx,x,y)
where mtx is a matrix of size (m,n)defining the histogram
mtx(i,j)=F(x(i),y(j)), withxandyvectors of size (1,m+1) and (1,n+1).- <opt_args>
This represents a sequence of statements
key1=value1,
                            key2=value2
,... wherekey1,key2,...can be one of the following: theta, alpha,leg,flag,ebox. See plot3d.- theta,alpha,leg,flag,ebox
see plot3d.
Description
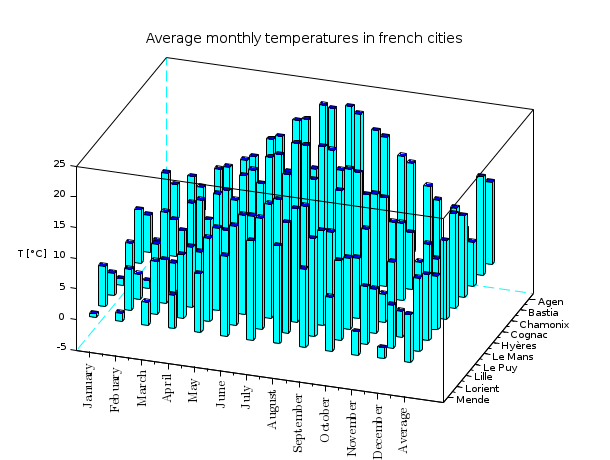
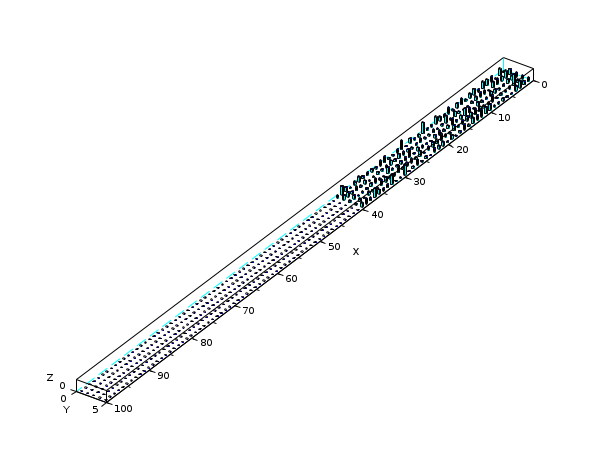
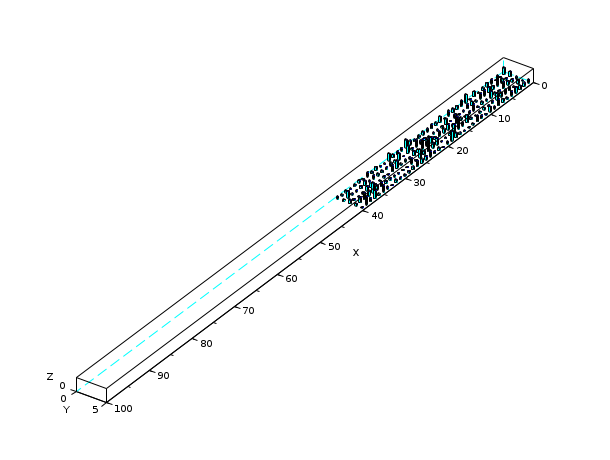
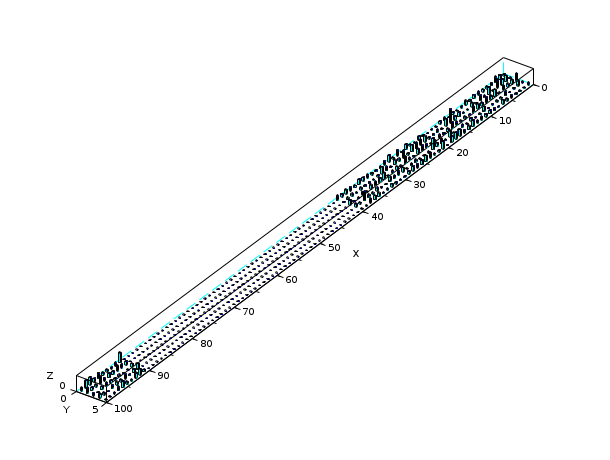
hist3d represents a 2d histogram as a 3D plot.
The values are associated to the intervals [x(i) x(i+1)[ X [y(i)
y(i+1)[
.
Enter the command hist3d() to see a demo.

Comments
Add a comment:
Please login to comment this page.