Scilab 6.0.0
- Aide de Scilab
- Graphiques
- Gestion des couleurs
- addcolor
- autumncolormap
- bonecolormap
- color
- color_list
- colorbar
- colordef
- colormap
- coolcolormap
- coppercolormap
- getcolor
- graycolormap
- hotcolormap
- hsv2rgb
- hsvcolormap
- jetcolormap
- name2rgb
- oceancolormap
- parulacolormap
- pinkcolormap
- rainbowcolormap
- rgb2name
- springcolormap
- summercolormap
- whitecolormap
- wintercolormap
Aide de Scilab >> Graphiques > Gestion des couleurs > hsvcolormap
hsvcolormap
Hue-saturation-value colormap
Syntax
cmap = hsvcolormap(n)
Arguments
- n
integer >= 1, the colormap size.
- cmap
matrix with 3 columns
[R,G,B].
Description
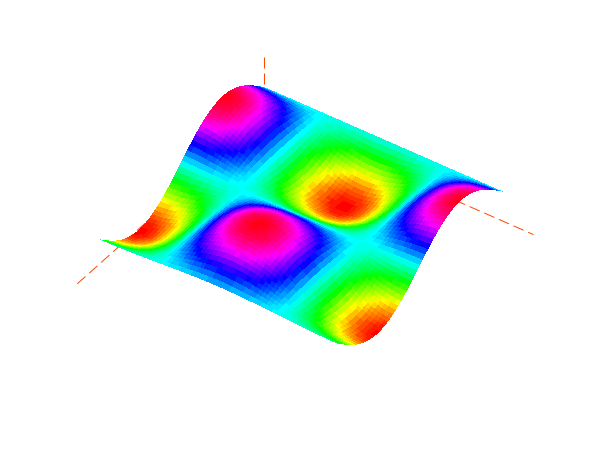
hsvcolormap computes a colormap with
ncolors. This colormap varies the hue component of the
hsv color model. The colors begin with red, pass through yellow, green,
cyan, blue, magenta, and return to red. The map is particularly
useful for displaying periodic functions.
Examples
t=[0:0.1:2*%pi]'; z=sin(t)*cos(t');
f=gcf();f.color_map=hsvcolormap(64);
plot3d1(t,t,z,35,45,"X@Y@Z",[-2,2,2])
See Also
- colormap — using colormaps
- autumncolormap — red through orange to yellow colormap
- bonecolormap — gray colormap with a light blue tone
- coolcolormap — cyan to magenta colormap
- coppercolormap — black to a light copper tone colormap
- graycolormap — linear gray colormap
- hotcolormap — red to yellow colormap
- hsvcolormap — Hue-saturation-value colormap
- jetcolormap — blue to red colormap
- oceancolormap — linear blue colormap
- parulacolormap — blue to yellow colormap
- pinkcolormap — sepia tone colorization on black and white images
- rainbowcolormap — red through orange, yellow, green,blue to violet colormap
- springcolormap — magenta to yellow colormap
- summercolormap — green to yellow colormap
- whitecolormap — completely white colormap
- wintercolormap — blue to green colormap
Comments
Add a comment:
Please login to comment this page.