Scilab 6.0.0
- Scilabヘルプ
- Graphics
- 2d_plot
- LineSpec
- Matplot
- Matplot1
- Matplot_properties
- Sfgrayplot
- Sgrayplot
- champ
- champ1
- champ_properties
- comet
- contour2d
- contour2di
- contourf
- errbar
- fchamp
- fec
- fec_properties
- fgrayplot
- fplot2d
- grayplot
- grayplot_properties
- graypolarplot
- histplot
- paramfplot2d
- plot
- plot2d
- plot2d2
- plot2d3
- plot2d4
- polarplot
- contour2dm
- scatter
Scilabヘルプ >> Graphics > 2d_plot > errbar
errbar
2次元プロットに垂直誤差バーを追加
呼び出し手順
errbar(x,y,em,ep)
引数
- x,y,em,ep
同じ大きさの行列.
説明
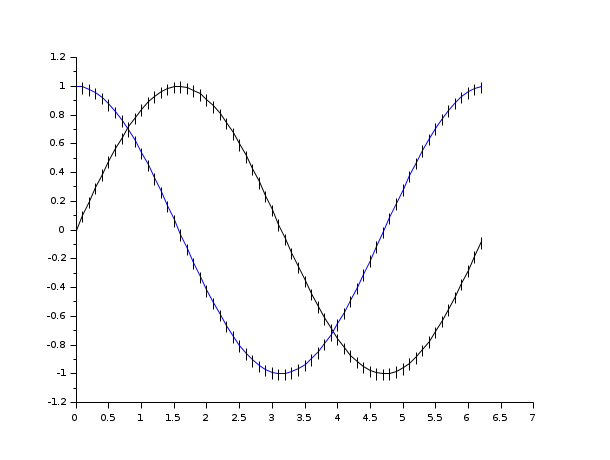
errbar は二次元プロットに垂直誤差バーを追加します.
xおよび y の意味はplot2d
におけるものと同じです.
em(i,j) と ep(i,j) は
値y(i,j)の誤差間隔を意味します:
[y(i,j)-em(i,j),y(i,j)+ep(i,j)].
デモを参照するには, コマンド errbar() を入力してください.
参照
- plot2d — 2Dプロット
Comments
Add a comment:
Please login to comment this page.