Scilab 6.0.0
Ajuda do Scilab >> Processamento de Sinais > Transforms > fftshift
fftshift
rearranges the fft output, moving the zero frequency to the center of the spectrum
Syntax
y=fftshift(x [,job])
Arguments
- x
real or complex vector or matrix.
- y
real or complex vector or matrix.
- job
integer, dimension selection, or string 'all'
Description
If x results of an fft computation y=fftshift(x) or y=fftshift(x,"all") moves the zero frequency component to the center
of the spectrum, which is sometimes a more convenient form.
If x is a vector of size n, y is the vector x([n/2+1:n,1:n/2])
If x is an m by n matrix y is the matrix
x([m/2+1:n,1:m/2],[n/2+1:n,1:n/2]).
[x11 x12]                  [x22 x21]
x=[       ]        gives   y=[       ]
[x21 x22]                  [x12 x11]
y=fftshift(x,n) makes the swap only along the nth dimension
Examples
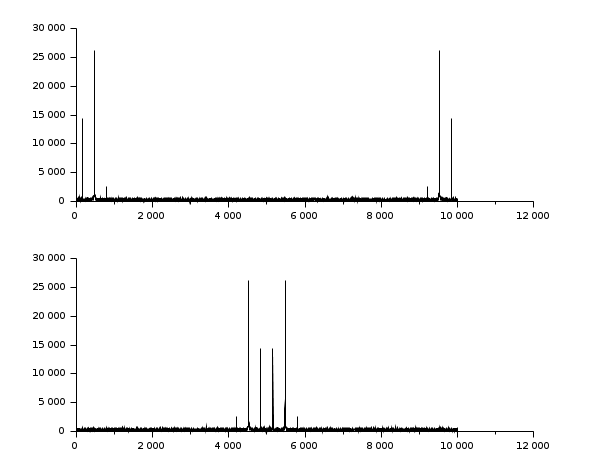
// Make a signal
t=0:0.1:1000;
x=3*sin(t)+8*sin(3*t)+0.5*sin(5*t)+3*rand(t);
// Compute the fft
y=fft(x,-1);

// Display
clf();
subplot(2,1,1);plot2d(abs(y))
subplot(2,1,2);plot2d(fftshift(abs(y)))
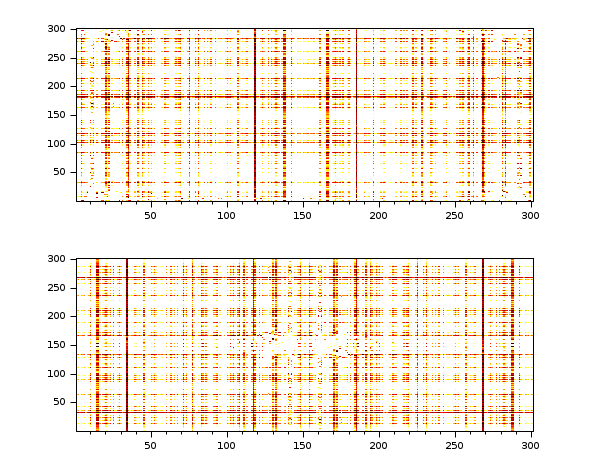
// Make a 2D image
t=0:0.1:30;
x=3*sin(t')*cos(2*t)+8*sin(3*t')*sin(5*t)+..
  0.5*sin(5*t')*sin(5*t)+3*rand(t')*rand(t);
// Compute the fft
y=fft(x,-1);

// Display
clf();
xset('colormap',hotcolormap(256))
subplot(2,1,1);Matplot(abs(y))
subplot(2,1,2);Matplot(fftshift(abs(y)))
Comments
Add a comment:
Please login to comment this page.