isoview
ajusta escalas para esboço isométrico (não muda o tamanho da janela)
Seqüência de Chamamento
isoview
isoview on
isoview off
isoview(idGraphics [,"on"|"off"])
isoview(xmin, xmax, ymin, ymax)    // DEPRECATED. use replot()
Parâmetros
- "on" | "off" | <none>
- Enables, disables, or switches the isometric rendering for all considered axes.
- idGraphics
- Vector of graphic handles. All the related axes are processed. By default, the current axes is processed.
- xmin, xmax, ymin, ymax
- Quatro valores reais: new axes bounds.
 These parameters will be removed from Scilab 6.1. Please used replot after
isoviewinstead.
Descrição
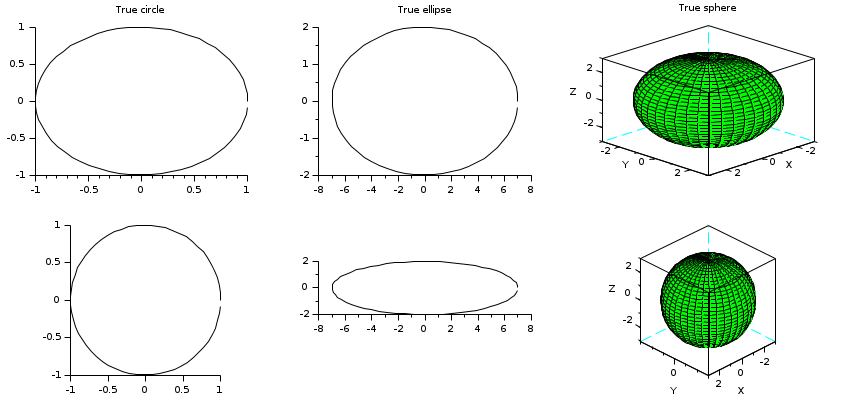
isoview is used to set or relax isometric rendering scales
on the x, y (and z) axes, without changing the size of the graphic window.
isoview() or simply isoview
switches the isoview status of the current axes, and keeps its current
bounds: isometric scales are set whenever
they were free, or scales are relaxed whenever they were isometric.
isoview("on") or isoview on
sets isometric scales for the current axes.
isoview("off") or isoview off
relaxes x, y (and z) scales for the current axes.
isoview(idGraphics,..) runs on axes related
to each graphic object listed in the vector idGraphics:
- If
idGraphics(i)is a figure's handle, all its Axes are considered. - If
idGraphics(i)is an Axes, it is considered as is. - If
idGraphics(i)is the handle of a sub-axes component(such as a polyline, a compound, etc), its hosting axes is considered.
isoview(xmin, xmax, ymin, ymax) sets the current
axes in isometric mode, and then sets its bounds to the given values.
| This usage
will be removed from Scilab 6.1. Please used
replot after
isoview instead. |
 | The current axes is still the same after calling
isoview(..), even when several axes have been processed. |
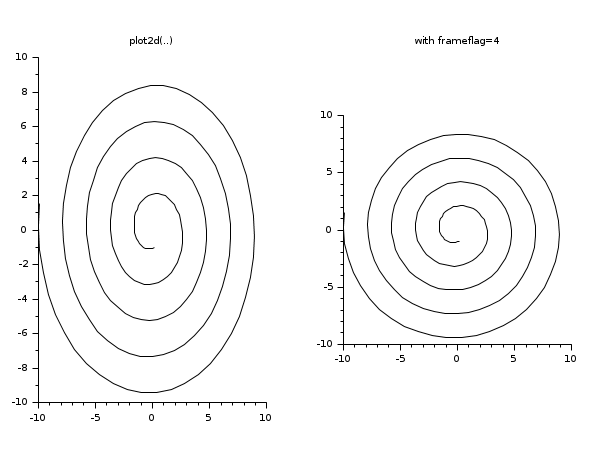
| To plot some curves directly in isometric mode without calling
isoview afterwards, the plot2d(...,frameflag=4)
option may be used at call time. |
Exemplos
t = [0:0.1:2*%pi]';
clf
nc = 3;

subplot(2,nc,1)
plot2d(cos(t),sin(t))
xtitle("True circle")
a1 = gca();

subplot(2,nc,nc+1)
plot2d(cos(t),sin(t))
isoview

subplot(2,nc,2)
plot2d(7*cos(t),2*sin(t))
xtitle("True ellipse")
a2 = gca();

subplot(2,nc,nc+2)
plot2d(7*cos(t),2*sin(t))
isoview

// plot of a sphere using facets computed by eval3dp
deff("[x,y,z] = sph(alp,tet)",[
      "x = r*cos(alp).*cos(tet)+orig(1)*ones(tet)"; ..
      "y = r*cos(alp).*sin(tet)+orig(2)*ones(tet)"; ..
      "z = r*sin(alp)+orig(3)*ones(tet)"]);
r = 3; orig = [0 0 0];
[xx,yy,zz] = eval3dp(sph,linspace(-%pi/2,%pi/2,40),linspace(0,%pi*2,40));
subplot(2,nc,3)
plot3d(xx, yy, zz, alpha=60, flag=[color("green") 8 4])
xtitle("True sphere")
a3 = gca();
subplot(2,nc,nc+3)
plot3d(xx, yy, zz, alpha=60, flag=[color("green") 8 4])
isoview

// Switching isoview status for all axes of the current figure
isoview(gcf())

// Forcing isoview for all its axes
isoview(gcf(), "on")

// Relaxing isoview for the current axes
isoview off

// Setting isoview for top axes
isoview(gcf(),"off")
isoview([a1 a2 a3], "on")
// Using plot2d(..., frameflag=4) :
r = linspace(1,10,200);
t = r*3;
scf();
subplot(1,2,1)
plot2d(r.*sin(t),r.*cos(t))
xtitle("plot2d(..)")

subplot(1,2,2)
plot2d(r.*sin(t),r.*cos(t),frameflag=4)
xtitle("with frameflag=4")
Ver Também
- square — ajusta escalas para esboço isométrico (muda o tamanho da janela)
- replot — reformula a área de exibição de um ou mais gráficos
- Axes properties — descrição das propriedades de entidades Axes (de eixos)
Histórico
| Versão | Descrição |
| 6.0 |
|
Comments
Add a comment:
Please login to comment this page.