Scilab 6.0.0
Ajuda do Scilab >> Xcos > Batch functions > xcos_simulate
If this function fails the error will be trapped and the simulation aborted.
If
If this function fails the error will be trapped.
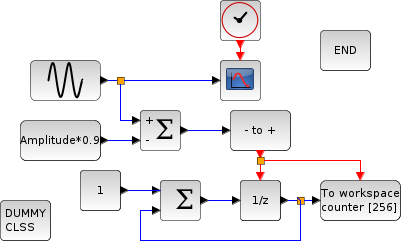 Simulate this diagram in batch mode and change some context values.
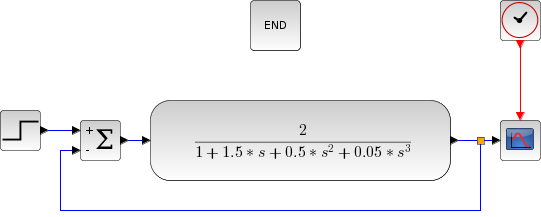 Simulate this diagram in batch mode and perform bode plotting of transfert function using post_xcos_simulate,
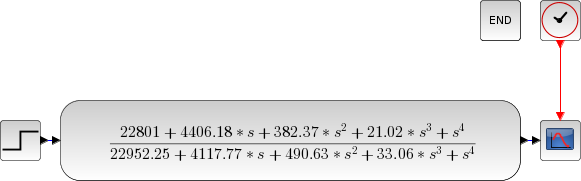 Simulate this diagram in batch mode and perform bode plotting of transfert function using post_xcos_simulate,
xcos_simulate
Function for running xcos simulation in batch mode
Syntax
[Info, status]=xcos_simulate(scs_m, needcompile)
Arguments
- scs_m: A diagram data structure (see scs_m structure).
- needcompile: An integer. If it equals 4, then the simulator will perform a complete compilation of the diagram. If not, it will use cached value of %cpr. DEPRECATED
- status: A boolean. %T if simulation is successful, %f if simulation fails.
Module
Description
This function is used to simulate xcos diagrams in batch mode. It requires the scs_m structure which can be obtained by loading in Scilab the.zcos file (see importXcosDiagram
).
User can also define pre_xcos_simulate
function that will run before simulation.
function continueSimulation=pre_xcos_simulate(scs_m, needcompile)
// Do nothing
continueSimulation = %t;
endfunction
continueSimulation is set to false, the simulation will stop.
User can also define post_xcos_simulate
function that will run after simulation.
function post_xcos_simulate(%cpr, scs_m, needcompile)
// Do Nothing
endfunction
File content
SCI/modules/xcos/macros/xcos_simulate.sci
Examples
The xcos diagram in SCI/modules/xcos/demos/batch_simulation.zcos.
importXcosDiagram("SCI/modules/xcos/demos/batch_simulation.zcos")

typeof(scs_m) //The diagram data structure

//This diagram uses 3 context variables :
//  Amplitude : the sin function amplitude
//  Pulsation : the sin function pulsation
//  Tf        : the final simulation time
scs_m.props.context //the embedded definition

//first batch simulation with the parameters embedded in the diagram
xcos_simulate(scs_m, 4);

// Change the final time value
scs_m.props.context = ["Amplitude=2" "Pulsation=3" "Tf=10"];
xcos_simulate(scs_m, 4);

// Now Change pulsation
scs_m.props.context = ["Amplitude=2" "Pulsation=9" "Tf=10"];
xcos_simulate(scs_m, 4);
//get the variable created by the "from workspace block"
counter
Statistic analysis of the diagram using pre_xcos_simulate function.
importXcosDiagram("SCI/modules/xcos/demos/batch_simulation.zcos")

typeof(scs_m) //The diagram data structure

// Declare pre_xcos_simulation to only analyze Diagram.

function continueSimulation=pre_xcos_simulate(scs_m, needcompile)
    // Retrieve all objects
    objs = scs_m.objs;

    links = 0;
    blocks = 0;
    other = 0;
    // Count Links and Blocks
    for i = 1:size(objs)
        currentType = typeof(objs(i));
        select (currentType)
        case "Link"
            links = links + 1;
        case "Block"
            blocks = blocks + 1;
        else
            other = other + 1;
        end
    end

        // Diplay Diagram analisys.
        disp("Diagram Analysis:")
        disp("Found "+string(blocks)+" Blocks.")
        disp("Found "+string(links)+" Links.")
        disp("Found "+string(other)+" Other component.")

        // We do not want any simulation, just analyze Diagram
        continueSimulation = %f;
    endfunction

    //first batch simulation with the parameters embedded in the diagram
    xcos_simulate(scs_m, 4);
The xcos diagram: SCI/modules/xcos/demos/Command.zcos
importXcosDiagram("SCI/modules/xcos/demos/Command.zcos")

// Clear any pre_xcos_simulation;
clear pre_xcos_simulate;

function post_xcos_simulate(%cpr, scs_m, needcompile)
    // Retrieve all objects
    objs = scs_m.objs;

    clrBlock = [];
    //Looking for CLR block
    for i=1:size(objs)
        if objs(i).gui == "CLR" then
            clrBlock = objs(i);
            break;
        end
    end

    // Check if we found some CLR
    if isempty(clrBlock) then
        disp("No CLR block found.")
        return
    end

    // Retrieve exprs
    exprs = clrBlock.graphics.exprs;
    s = poly(0,'s');
    num = eval(exprs(1));
    den = eval(exprs(2));
    h = syslin('c', num/den);
    // Open new figure then plot Bode
    scf(max(winsid())+1);
    bode(h, 0.01, 100);
endfunction

xcos_simulate(scs_m, 4);
The xcos diagram: SCI/modules/xcos/demos/Command_bode.zcos
importXcosDiagram("SCI/modules/xcos/demos/Command_bode.zcos")

// Clear any post_xcos_simulation;
clear post_xcos_simulate;

function continueSimulation=pre_xcos_simulate(scs_m, needcompile)
    // Retrieve all objects
    objs = scs_m.objs;

    clrBlock = [];
    //Looking for CLR block
    for i=1:size(objs)
        if objs(i).gui == "CLR" then
            clrBlock = objs(i);
            break;
        end
    end

    // Check if we found some CLR
    if isempty(clrBlock) then
        disp("No CLR block found.")
        return
    end

    // Retrieve exprs
    exprs = clrBlock.graphics.exprs;
    s = poly(0,'s');
    num = eval(exprs(1));
    den = eval(exprs(2));
    h = syslin('c', num/den);
    // Open new figure then plot Bode
    scf(max(winsid())+1);
    bode(h, 0.01, 100);

    // Stop after bode plot. We do not want any simulation.
    continueSimulation = %f;
endfunction

xcos_simulate(scs_m, 4);
Comments
Add a comment:
Please login to comment this page.