barhomogenize
homogenize all the bars included in the current working axes
Syntax
barhomogenize()
barhomogenize([h[,'style'[,'width']]])
Arguments
- h
an axes handle, (default: h=gca() ).
- style
a string, 'grouped' or 'stacked' (default: 'grouped').
- width
(optional), a real scalar, defines the width (a percentage of the available room) for the bar (default: 0.8).
Description
If there are several bar calls, the barhomogenize function
allows to homogenize the width and style of all bars (i.e which has the
polyline_style type 6) included in the current working axes.
These bars must have the same x data.
barhomogenize( ) : takes the default values, h=gca(),
width=0.8, style='grouped'.
barhomogenize(h,...) : defines the current axes where the
drawing is performed.
barhomogenize(...,width,...) : defines the width of the
bar(s) in percentage (generally: 0<width<=1).
barhomogenize(...,style,...) : defines how the bars are
drawn. The 'grouped' option allows to center the M polylines versus each
components of x, and the 'stacked' option allows to stack them.
Examples
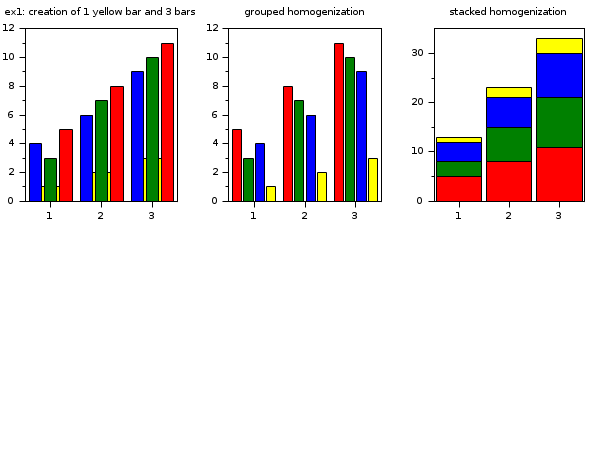
// First example: creation of 1 yellow bar (i.e 1 polyline with polyline_style=6) and 3 bars (i.e 3 polylines with polyline_style=6)
subplot(2,3,1)
xtitle('ex1: creation of 1 yellow bar and 3 bars')
x=1:3;
y1=1:3;
y2=[4 3 5;6 7 8;9 10 11];
bar(x,y1,'yellow');bar(x,y2);

// grouped homogenization of these 4 bars
subplot(2,3,2)
xtitle('grouped homogenization')
x=1:3;
y1=1:3;
y2=[4 3 5;6 7 8;9 10 11];
bar(x,y1,'yellow');bar(x,y2);
barhomogenize();

// stacked homogenization of the 4 bars
subplot(2,3,3)
xtitle('stacked homogenization')
x=1:3; y1=1:3; y2=[4 3 5;6 7 8;9 10 11];
bar(x,y1,'yellow');bar(x,y2);
barhomogenize('stacked',1);
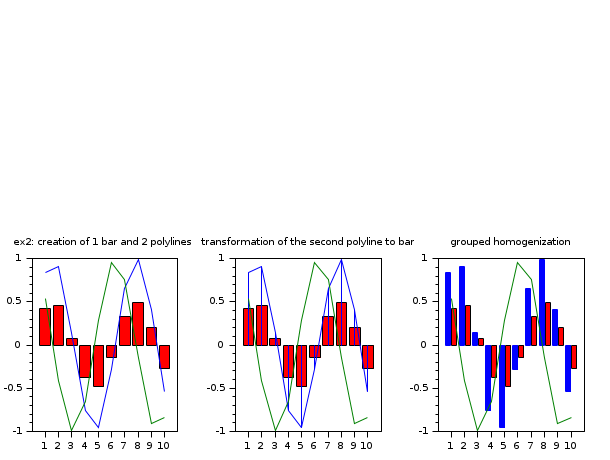
// Second example : creation of 1 red bar (i.e 1 polyline with polyline_style=6) and 2 polylines with type=1 (calling plot function)
subplot(2,3,4)
xtitle('ex2: creation of 1 bar and 2 polylines')
x=1:10;
y=sin(x)/2;
bar(x,y,'red')
x1=1:10;
y1=[sin(x);cos(x)]
plot(x1',y1')

// modify the polyline_style type of the second polyline from plot (this polyline becomes a bar)
subplot(2,3,5)
xtitle('transformation of the second polyline to bar')
x=1:10;
y=sin(x)/2;
bar(x,y,'red')
x1=1:10;
y1=[sin(x);cos(x)]
plot(x1',y1')
e=gce();
e2=e.children(2);
e2.polyline_style=6;

// homogenization of the first bar (from bar function) and second bar (from the modification).
subplot(2,3,6)
xtitle('grouped homogenization')
x=1:10;
y=sin(x)/2;
bar(x,y,'red')
x1=1:10;
y1=[sin(x);cos(x)]
plot(x1',y1')
e=gce();
e2=e.children(2);
e2.polyline_style=6;
barhomogenize();
// change the style and the width
//barhomogenize('stacked',0.5);
//barhomogenize('stacked',1);
See Also
- bar — bar histogram
- polyline_properties — description of the Polyline entity properties
Comments
Add a comment:
Please login to comment this page.