Scilab 6.0.0
Справка Scilab >> Графики > axes_operations > subplot
subplot
divide a graphics window into a matrix of sub-windows
Syntax
subplot(m,n,p)
subplot(mnp)
Arguments
- m,n,p
positive integers
- mnp
an integer with decimal notation
mnp
Description
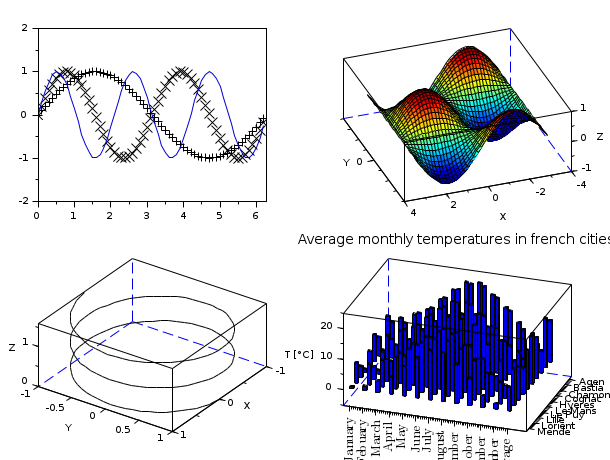
subplot(m,n,p) or subplot(mnp) breaks the graphics window into an m-by-n matrix of sub-windows and selects the p-th sub-window for drawing the current plot. The number of a sub-window into the matrices is counted row by row ie the sub-window corresponding to element (i,j) of the matrix has number (i-1)*n + j.
Examples
Comments
Add a comment:
Please login to comment this page.