Logyard Drain Examples
Detailed instructions on how to use drains with third party log analysis software or services:
Note
Do not forward both application and system logs to the same destination.
Papertrail
- Create an account for Papertrail
- In the Dashboard screen, click Add Systems.

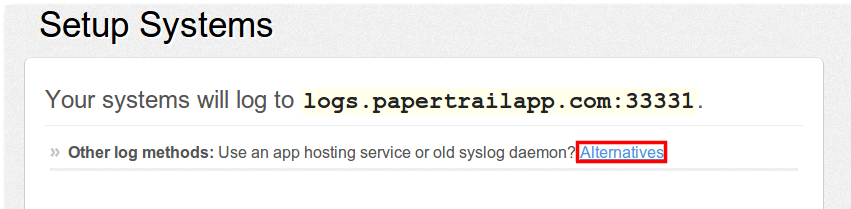
- In the Setup Systems screen under Other log methods, click Alternatives.
- Choose option C: My system's hostname changes and give it a suitable name.
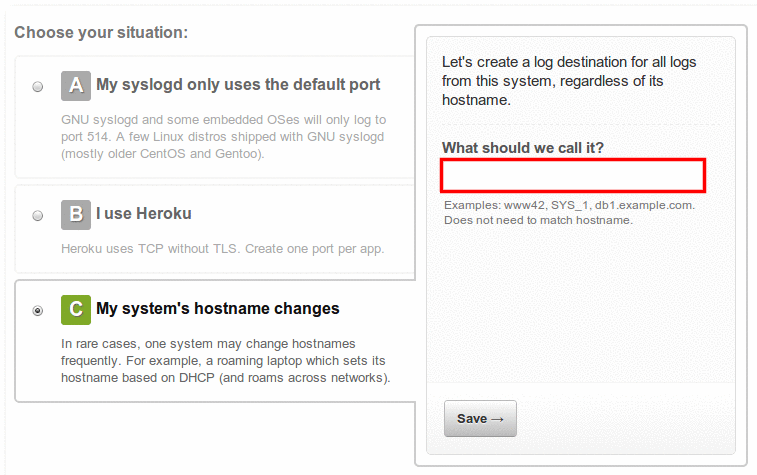
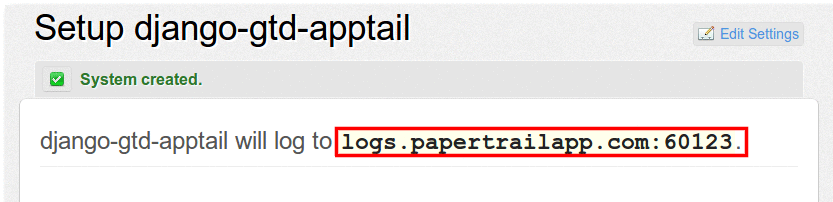
- Note down the port number. You need this later on.
Application Logging
Enable application logging (via udp) by executing the following client command:
stackato drain add drain-name udp://logs.papertrailapp.com:port#
System Logging
Enable system logging (via udp) by executing the following kato command:
kato log drain add drain-name udp://logs.papertrailapp.com:port#
Loggly
- Create an account for Loggly
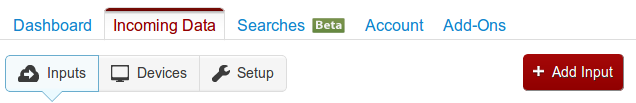
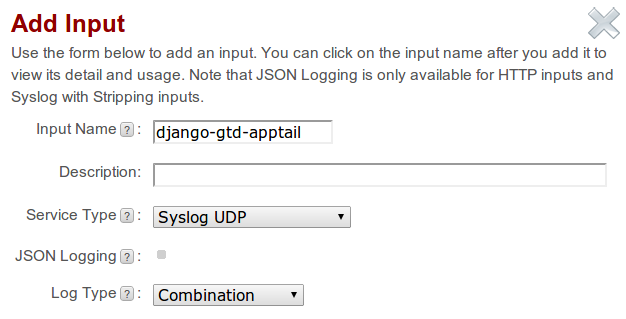
- Under Incoming Data tab, click Add Input.
- In the Add Input screen:
- Choose Syslog UDP or TCP
- Choose Combination Log Type
- [Optional] For JSON Logging, Choose UDP or TCP with Stripe and enable JSON Logging. (for system logs)
- If we want to accept logs from any Stackato nodes or applications modify Allowed Devices section:
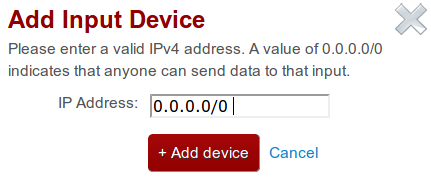
- Click Add device
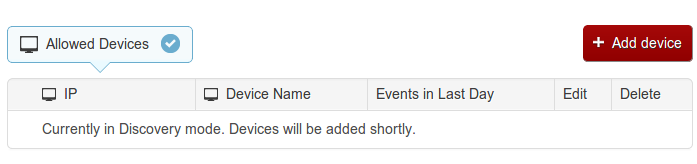
- Add IP Address 0.0.0.0/0 when prompted
- Turn off discovery since we allowed all devices. Also, note down the port number.

Application Logging
Enable application logging by executing the following client command:
stackato drain add drain-name udp://logs.loggly.com:port#
OR
stackato drain add drain-name tcp://logs.loggly.com:port#
System Logging
Enable system logging by executing the following kato command:
kato log drain add drain-name udp://logs.loggly.com:port#
OR
kato log drain add drain-name tcp://logs.loggly.com:port#
Loggly supports JSON format with minor configuration changes shown above.
Enable system JSON logging by executing the following kato command:
kato log drain add --format json drain-name tcp://logs.loggly.com:port#
Splunk
- Setup Splunk Server.
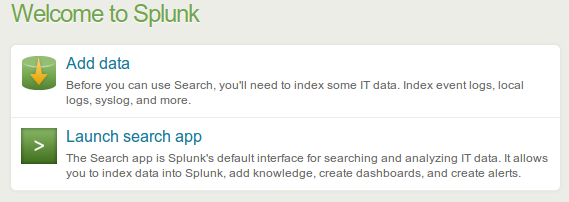
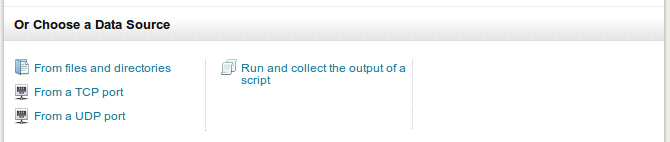
- In the welcome screen, click Add data
- Under Choose a Data Source, click “From a TCP port”. (or UDP)
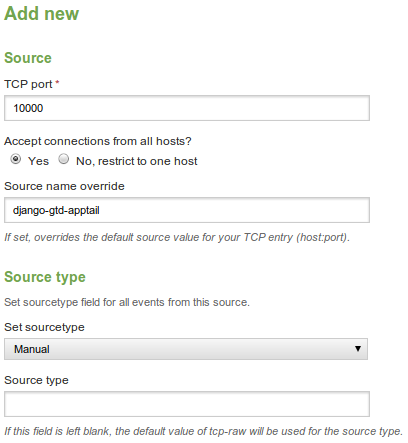
- In the Add new Source screen:
- Select a TCP/UDP port greater than 9999
- Give it a suitable Source name.
- Set sourcetype to Manual
- Leave Source Type empty
Application Logging
Enable application logging by executing the following client command:
stackato drain add drain-name udp://splunk-server-address:port#
OR
stackato drain add drain-name tcp://splunk-server-address:port#
System Logging
Enable system logging by executing the following kato command:
kato log drain add drain-name udp://splunk-server-address:port#
OR
kato log drain add drain-name tcp://splunk-server-address:port#
Splunk supports JSON format without further configuration.
Enable system JSON logging by executing the following kato command:
kato log drain add --format json drain-name tcp://splunk-server-address:port#
Hello World Custom Drain
The command below starts a drain target server on a node, piping to a local file:
nc -lk 0.0.0.0 10000 > log-output.txt
As long as that nc command runs, this will funnel logs from all drains targeting it into the file log-output.txt