Sometimes you need to know where branches and tags were taken from
the trunk, and the ideal way to view this sort of information is
as a graph or tree structure. That's when you need to use
→
This command analyses the revision history and attempts to create a tree showing the points at which copies were taken, and when branches/tags were deleted.
Important
In order to generate the graph, TortoiseSVN must fetch all log messages from the repository root. Needless to say this can take several minutes even with a repository of a few thousand revisions, depending on server speed, network bandwidth, etc. If you try this with something like the Apache project which currently has over 500,000 revisions you could be waiting for some time.
The good news is that if you are using Log Caching, you only have to suffer this delay once. After that, log data is held locally. Log caching is enabled in TortoiseSVN's settings.
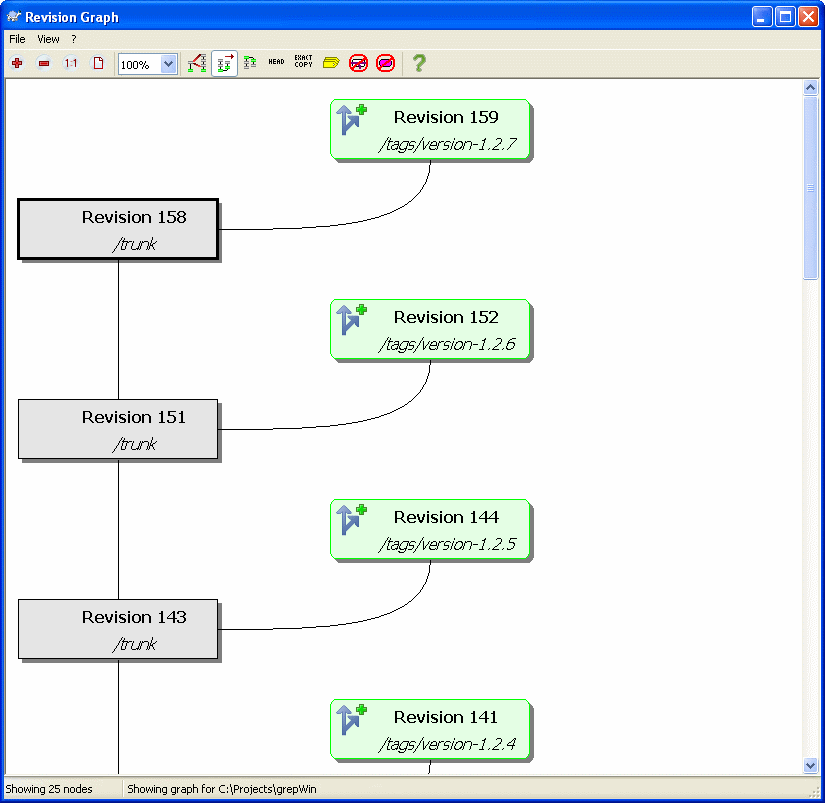
The revision graph shows several types of node:
- Added file/folder
Items which have been added, or created by copying another file/folder are shown using a rounded rectangle.
- Deleted file/folder
Deleted items eg. a branch which is no longer required, are shown using an octagon (rectangle with corners cut off).
- Branch tip revision
Where a branch (or trunk or tag) has been modified since the last branch node, this is shown using an ellipse. Shown when the Show HEAD revisions option is selected.
- Normal file/folder
All other items are shown using a plain rectangle.
Note that by default the graph only shows the points at which items were added or deleted. Showing every revision of a project will generate a very large graph for non-trivial cases. If you really want to see all revisions where changes were made, there is an option to do this in the View menu and on the toolbar.
Because a revision graph is often quite complex, there are a number of features which can be used to tailor the view the way you want it. These are available in the View menu and from the toolbar.
- Group branches
The default behavior (grouping off) will use one row per revision and all rows are sorted strictly by revision. As a result, long-living branches occupy a whole column for only a few changes and the graph becomes very broad.
This mode groups changes by branch, so that there is no global revision ordering: Consecutive revisions on a branch will be shown in (often) consecutive lines. Sub-branches, however, are arranged in such a way that later branches will be shown in the same column above older branches to keep the graph slim. As a result, a given row may contain changes from different revisions.
- Oldest on top
Normally the graph shows the oldest revision at the bottom, and the tree grows upwards. Use this option to grow down from the top instead.
- Show HEAD revisions
This ensures that the latest revision on every branch is always shown on the graph.
- Exact copy sources
When a branch/tag is made, the default behaviour is to show the branch as taken from the last node where a change was made. Strictly speaking this is inaccurate since the branches are often made from the current HEAD rather than a specific revision. So it is possible to show the more correct (but less useful) revision that was used to create the copy.
- Fold tags
If you want to see a graph of software development, tagged releases may be of little interest to you. This option hides the nodes for tags and shows them instead in the tooltip for the node that they were copied from. A tag icon on the right side of the source node indicates that tags were made.
- Reduce cross lines
If the layout of the graph has produced a lot of crossing lines, use this option to clean it up. This may make the layout columns appear in less logical places, for example in a diagonal line rather than a column, and it may take a little time to optimise.
- Filter
Sometimes the revision graph contains more revisions than you want to see. This option opens a dialog which allows you to restrict the range of revisions displayed, and to hide particular paths by name.
To make it easier to navigate a large graph, use the overview window. This shows the entire graph in a small window, with the currently displayed portion highlighted. You can drag the highlighted area to change the displayed region.
The revision date, author and comments are shown in a hint box whenever the mouse hovers over a revision box.
If you select two revisions (Use Ctrl-left click), you can use the context menu to show the differences between these revisions. You can choose to show differences as at the branch creation points, but usually you will want to show the differences at the branch end points, i.e. at the HEAD revision.
You can view the differences as a Unified-Diff file, which shows all differences in a single file with minimal context. If you opt to → you will be presented with a list of changed files. Double click on a file name to fetch both revisions of the file and compare them using the visual difference tool.
If you right click on a revision you can use → to view the history.
You can also merge changes in the selected revision(s) into a different working copy. A folder selection dialog allows you to choose the working copy to merge into, but after that there is no confirmation dialog, nor any opportunity to try a dry run. It is a good idea to merge into an unmodified working copy so that you can revert the changes if it doesn't work out! This is a useful feature if you want to merge selected revisions from one branch to another.
Caution
Because Subversion cannot provide all the information required, a certain amount of interpretation is required, which can sometimes give strange results. Nevertheless, the output for the trunk will generally give useful results.
If you want to check the server again for newer information, you can simply refresh the view using F5. If you are using the log cache (enabled by default), this will check the repository for newer commits and fetch only the new ones. If the log cache was in offline mode, this will also attempt to go back online.
If you are using the log cache and you think the message content or author may have changed, you should use the log dialog to refresh the messages you need. Since the revision graph works from the repository root, we would have to invalidate the entire log cache, and refilling it could take a very long time.