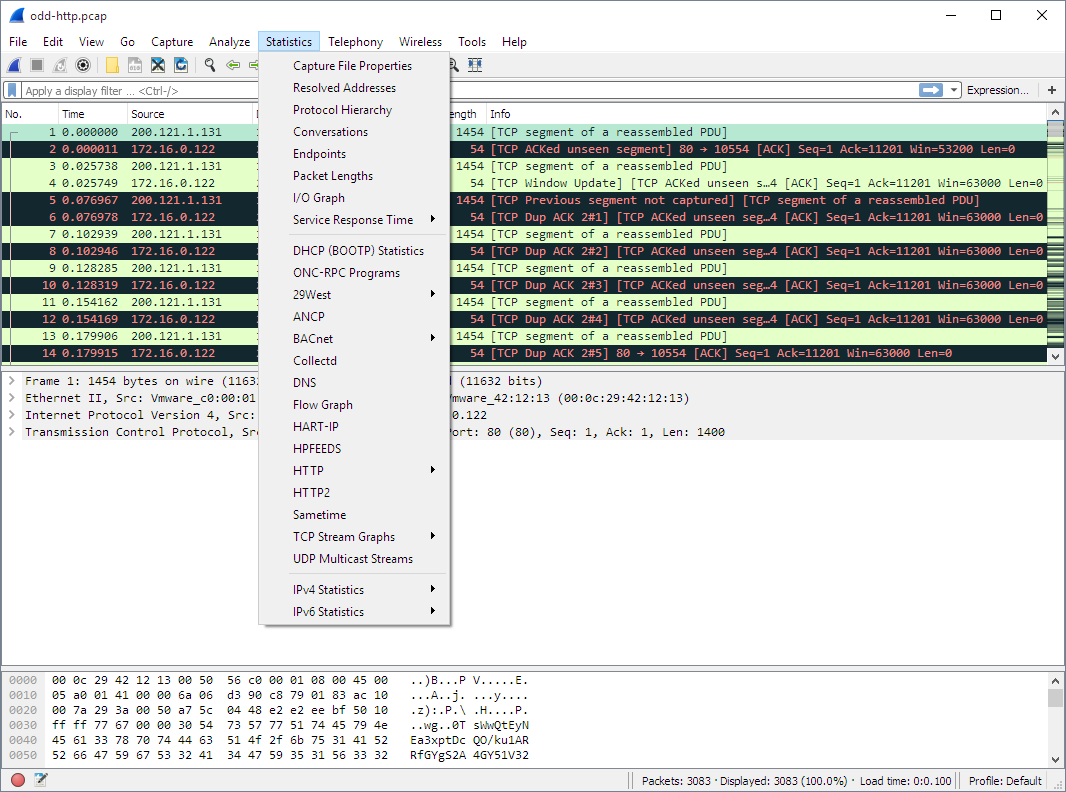
| | Show information about the data captured, see Section 8.2, “The Summary window”. |
| | Display a hierarchical tree of protocol statistics, see Section 8.3, “The "Protocol Hierarchy" window”. |
| | Display a list of conversations (traffic between two endpoints), see Section 8.4.1, “The “Conversations” window”. |
| | Display a list of endpoints (traffic to/from an address), see Section 8.5.1, “The "Endpoints" window”. |
| | See Section 8.10, “The protocol specific statistics windows” |
| | Display user specified graphs (e.g. the number of packets in the course of time), see Section 8.6, “The "IO Graphs" window”. |
| | Display the time between a request and the corresponding response, see Section 8.7, “Service Response Time”. |
| | See Section 8.10, “The protocol specific statistics windows” |
| | See Section 8.10, “The protocol specific statistics windows” |
| | See Section 8.10, “The protocol specific statistics windows” |
| | See Section 8.10, “The protocol specific statistics windows” |
| | HTTP request/response statistics, see Section 8.10, “The protocol specific statistics windows” |
| | See Section 8.10, “The protocol specific statistics windows” |
| | See Section 8.10, “The protocol specific statistics windows” |
| | See Section 8.10, “The protocol specific statistics windows” |
| | See Section 8.10, “The protocol specific statistics windows” |
| | See Section 8.10, “The protocol specific statistics windows” |
| | See Section 8.10, “The protocol specific statistics windows” |
| | See Section 8.10, “The protocol specific statistics windows” |
| | See Section 8.9, “WLAN Traffic Statistics” |
| | See Section 8.10, “The protocol specific statistics windows” |