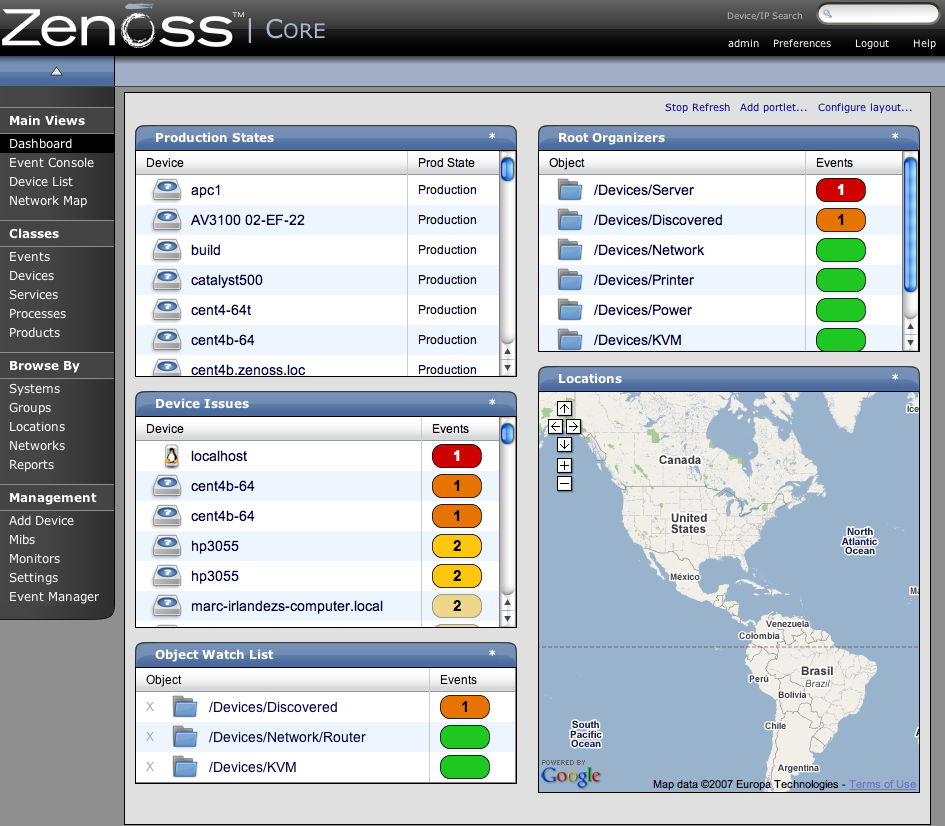
Once you have installed Zenoss and entered the URL for the UI, the Zenoss Dashboard appears. The Dashboard is the primary window into the devices, events and activities within the Zenoss system. The Dashboard shows Systems-level event summaries, devices that currently have events with severity of at least “Error” magnitude, and infrastructure issues along with a navigational bar. There is a search field, where you can enter a machine’s name or partial name or IP address. All or some of a machine's name may be typed in to search for it, as well as an IP address. User information may be accessed through the “Preferences” link in the top right of the screen. Below the Preferences link is the time and date that Zenoss was last updated. Every 60 seconds there is an AJAX call that refreshes the data fields and polls for new data. If the poll fails, it will display “Lost Connection to Zenoss” near the User information area.