Once Zenoss discovers and models a device it assigns certain properties and attributes to a device and classifies these discoveries throughout a Device's information tabs. The following tabs are available when an individual device is selected.
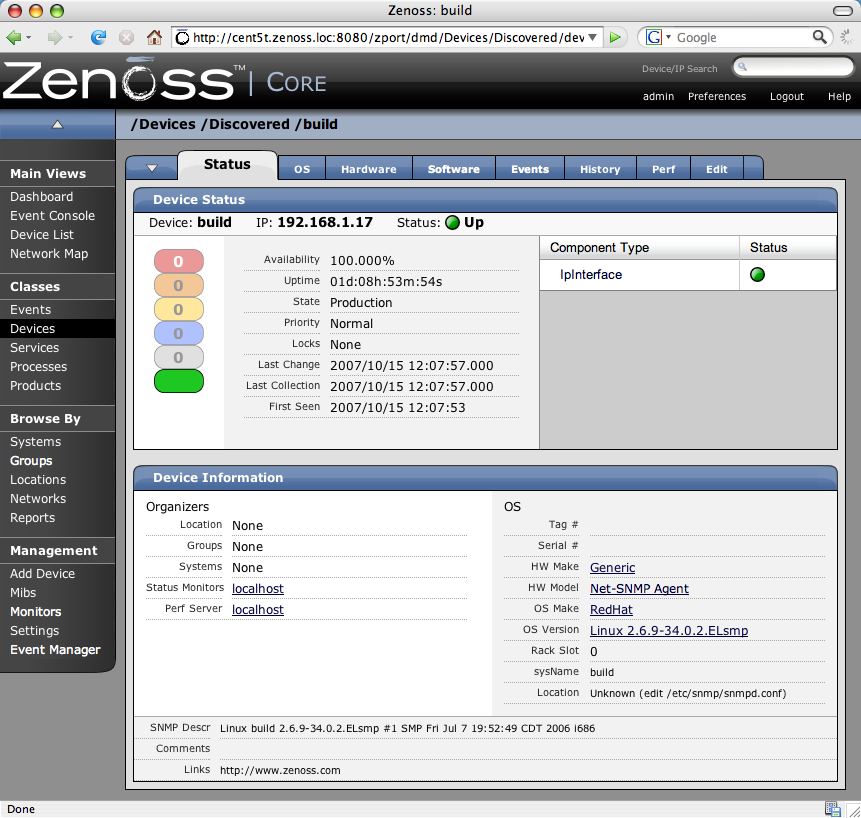
The Status tab is the default tab that is shown when you click on a device.
There is a Device Status table that shows important device status at a glance. The number of events grouped by severity can be found on the left side of this table. You can click on the 'Event Rainbow' to view the list of events for the device.
Also on the left side of the Device Status table is the device availability, uptime, last collection and modified time. On the right side of the Device Status table is the Component Status list. Each item in the list is a type of device component, which are IpService, WinService, IpRouteEntry, IpInterface, CPU, FileSystem, and Other. The status of each device component type is determined by the collective status of the monitored components of the same type. If the IpService status is green, then all monitored IpServices on this device are functioning normally. If there is an event related to a monitored IpService, the component and highest severity event associated with that component will be displayed in the status. If there is an event unrelated to a known component, it will be placed under the component type Other. If you click on the component type, you will be sent to the OS tab of the Device where you can manage the components on this device.
-
Click on the "OS" tab of any device. If you do not have an IpInterface eth0, add the interface by clicking the "Add IpInterface" menu item in the "Add..." submenu. Once you have added the component you'll want it to be monitored.
-
On the IpInterface edit screen, set Monitor to "True" and click "Save".
-
Now return to the Device Status page.
The IpInterface type should appear.
-
Now update the table by sending an event linked to a component and and not linked to any know components. From the left navigation menu, click Events.
-
From the page menu, click on the "Add Event" menu item. Enter the name of the device. In the Component field, enter "eth0". Leave the severity as "Critical" and click the "OK" button.
-
Now send another event, once again use the "Add Event" menu item. Enter the name of the device. In the Component field, enter "Not a known component" (or any other string that isn't a name of a component on this device) Set the severity to "Error" and click the "OK" button.
-
Now refresh the Device Status page.
You should see that the IpInterface type group has a component "eth0" with a red status indicating that a Critical event has been received.
-
If you click on the status bubble, you will be taken to the Events page for that device. You'll also notice that you have a new type group, Other, with the component name we chose earlier. The status color of this component should be orange which represents the Error event you created.
There is also a Device Information table that shows device details. The left side of the Device Information table has the assigned organizers such as Location, Device Groups, Systems as well as the assigned status monitors and performance monitor. You can click on a organizer or monitor to view the status page for the organizer or monitor. The right side of the Device Information table includes data about the hardware and operating system of the device.
The OS tab contains logical Operating System components such as:
-
Interfaces
-
IP Services
-
Win Services (for Windows devices)
-
File Systems
-
Routes
-
OS Processes
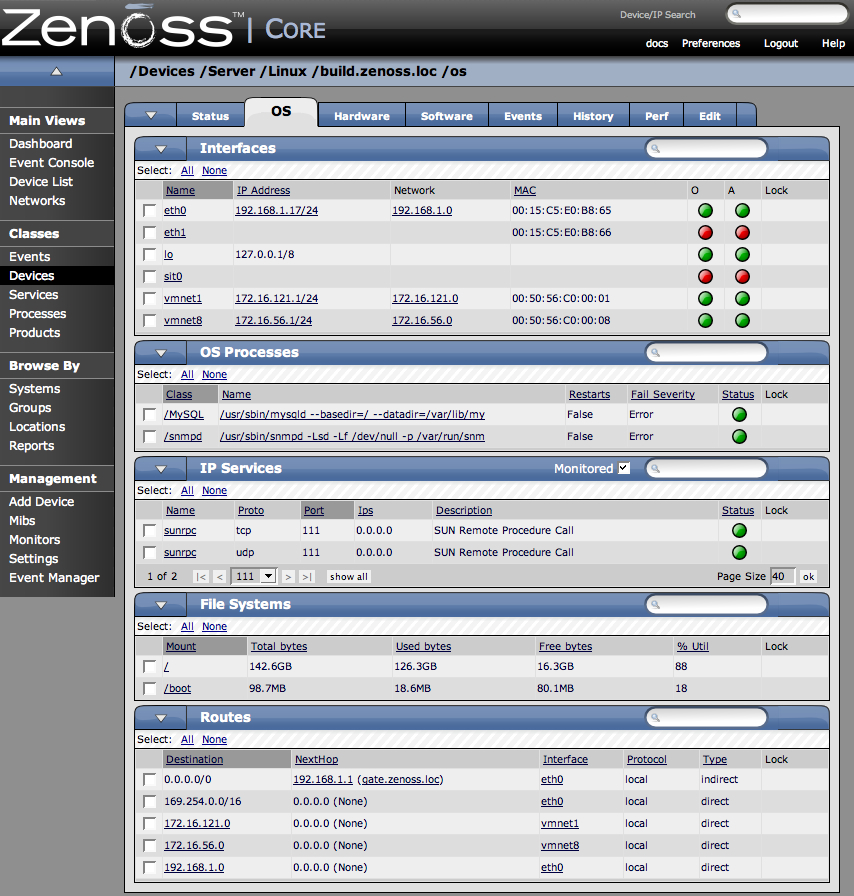
File system monitoring is only usable if the system has a good HOST-RESOURCES mib. File systems monitor the amount of blocks used and show total bytes, available bytes, used bytes and percent used. You can set thresholds to alert when a specific event occurs such as the disk reaches 90% utilization.
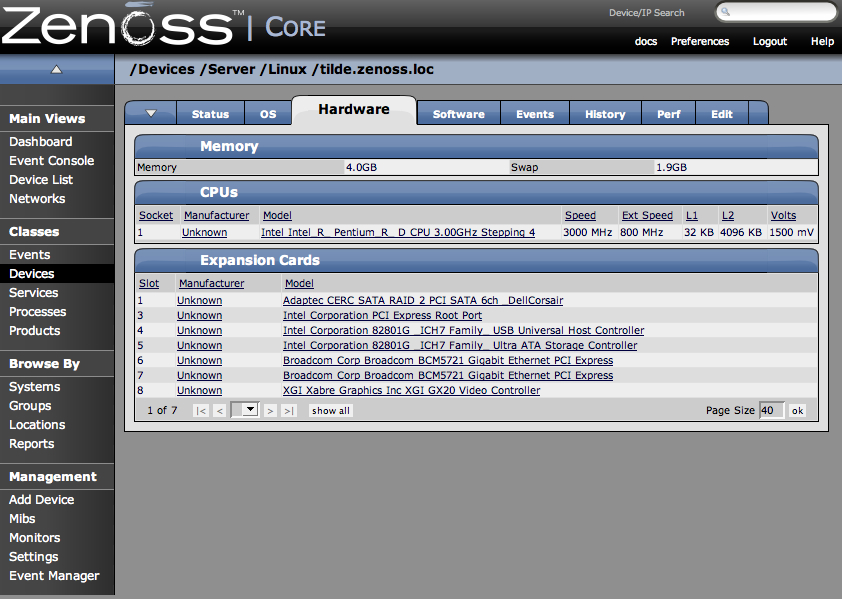
The Hardware tab gives you information about the device’s available/used memory, available/used swap and information on the CPU(s).
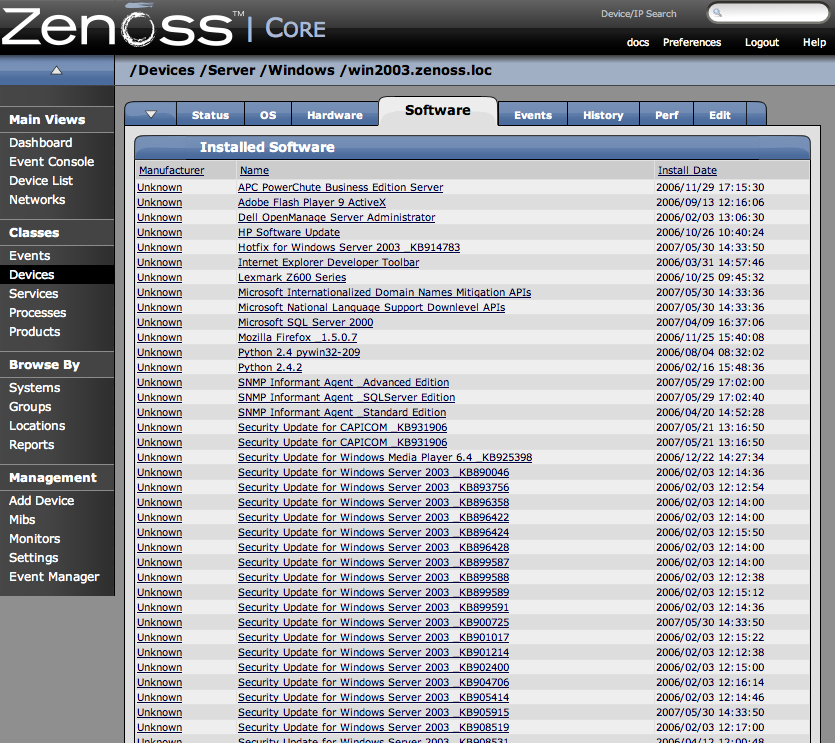
The Software tab gives a list of all installed software. This software can be sorted by Manufacturer, Name or Install Date.
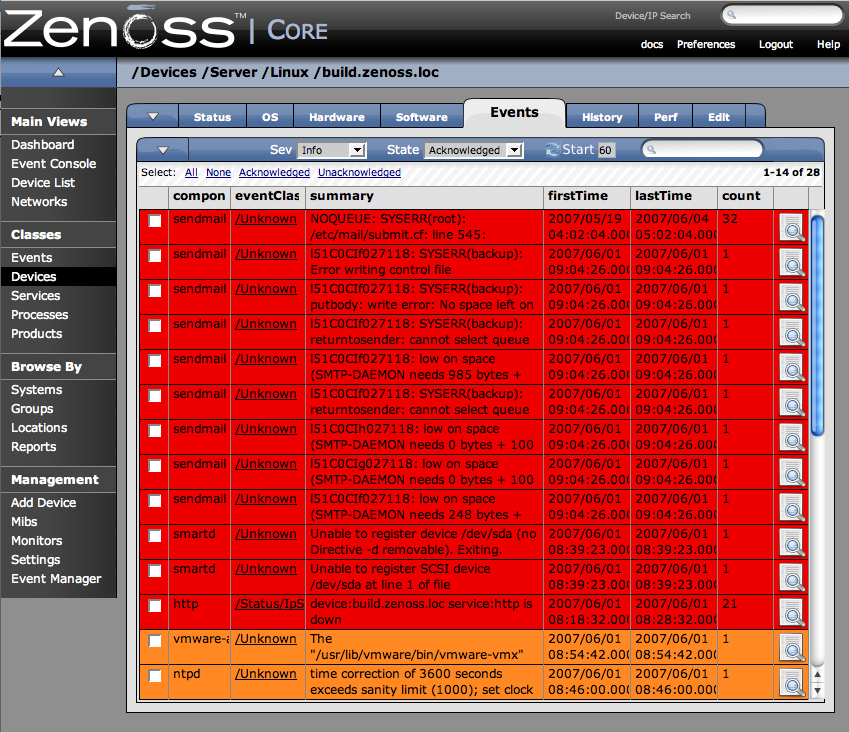
The Events tab is very similar to other event views. You can sort events using several items including, but not limited to, Component, EventClass and Count. You can also filter events by Severity, State or a regular expression applied over all events. You can also can move, map or acknowledge Events here.
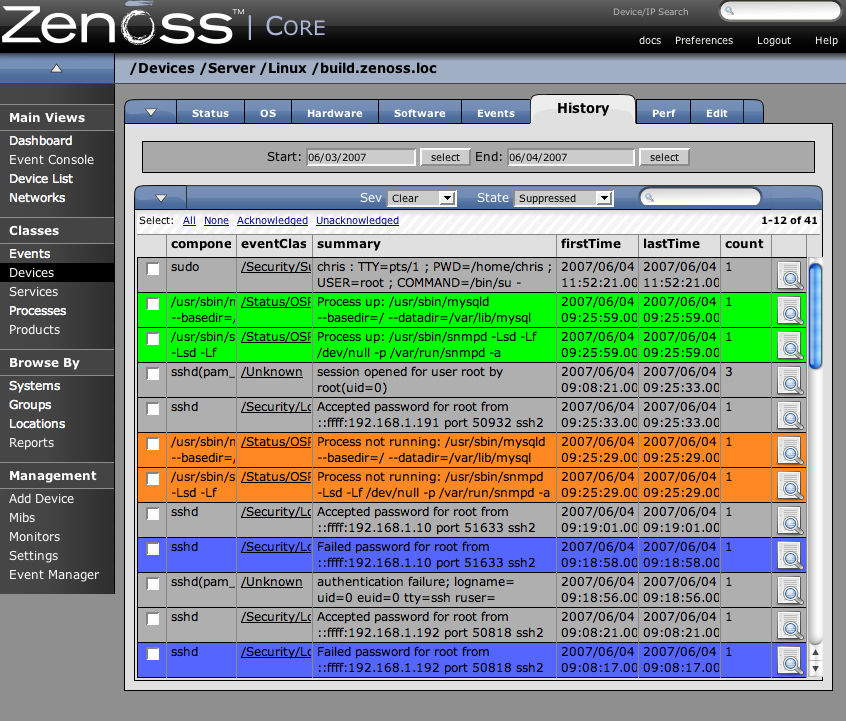
The History tab shows the events that have finished with the event life cycle by some means and have been archived in the history.
The Perf tab shows performance graphs for the currently selected device. It displays Load Average 5 Min, CPU Utilization, CPU Idle, Free Memory and Free Swap. This can be changed to update hourly, daily, weekly, monthly or yearly.
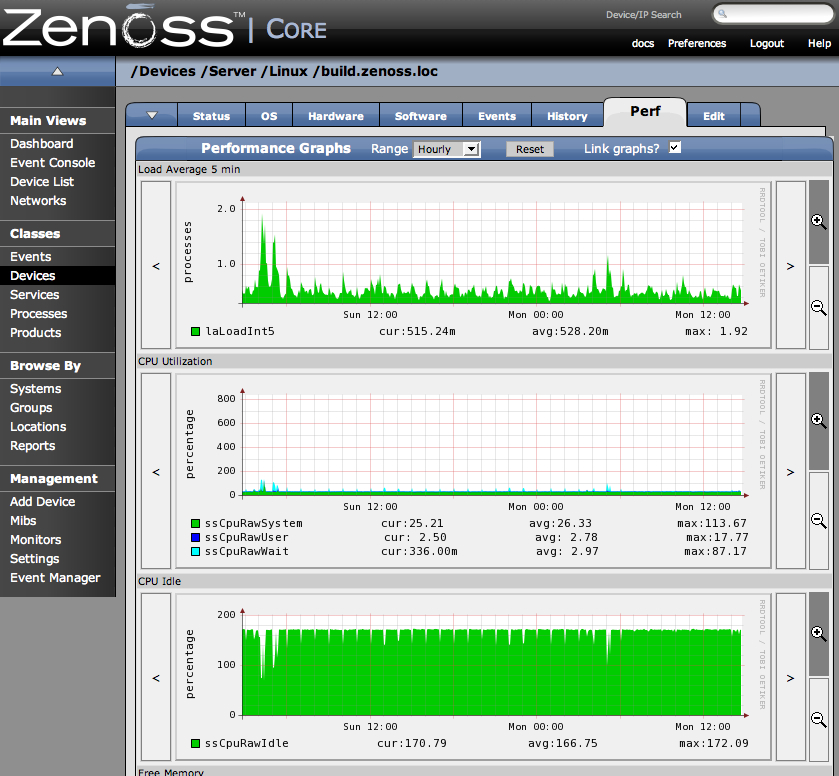
You can use the controls on the sides of the graph to “graph surf”. Graph surfing is when you use the controls on the sides of the graph to change the graph and look at it in different ways. The arrows and magnifying glasses allow you to see the data in different ways.
The default is that all the graphs move in sync with one another so that if you click the back arrow for any graph, they will all move backward, however you can keep it so that the arrow for each graph only works for that particular graph by un-checking the Link Graphs box.
The Reset button returns to the default (initial view) of the graphs. Scrolling data back and forth horizontally. To scroll data on the horizontally, use the arrows on either side of each graph. Each click will scroll the next unit back and once you have scrolled data back, you can also use the arrows to scroll the graphs forward.
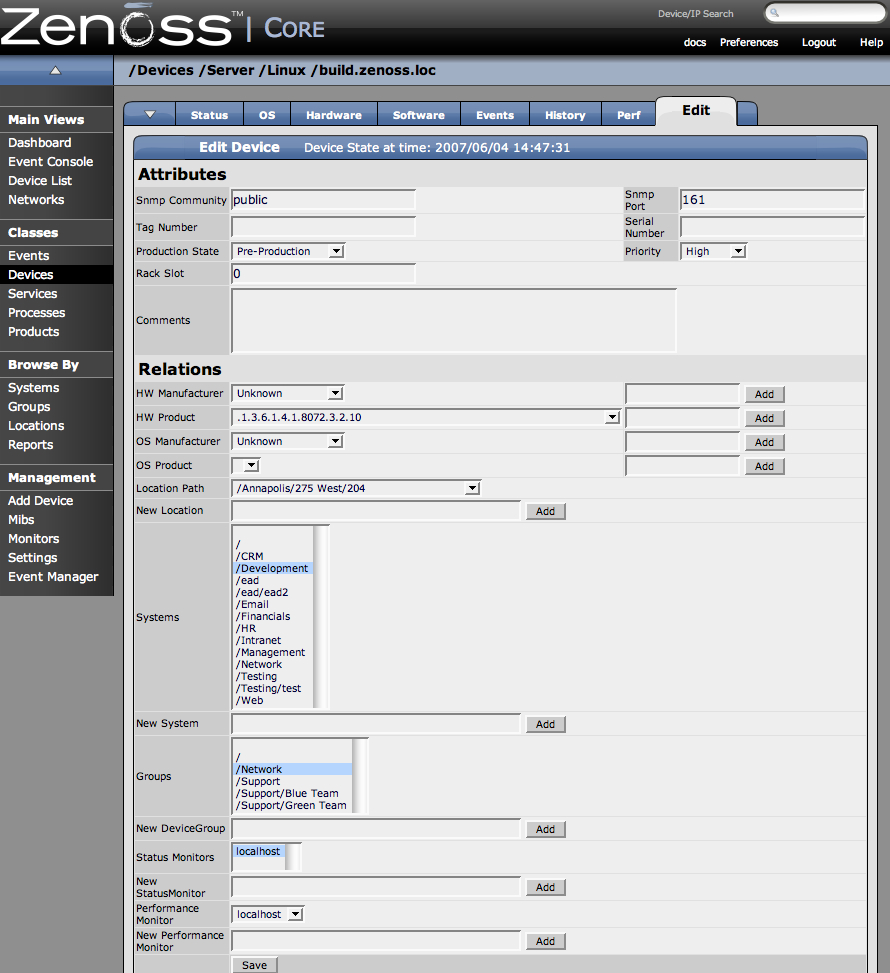
Use this tab to change any of the properties of the device.
The Custom tab allows you to set values in the custom fields you define in Custom Schema. To access the Custom tab, open the Device page menu, select More and then Custom.

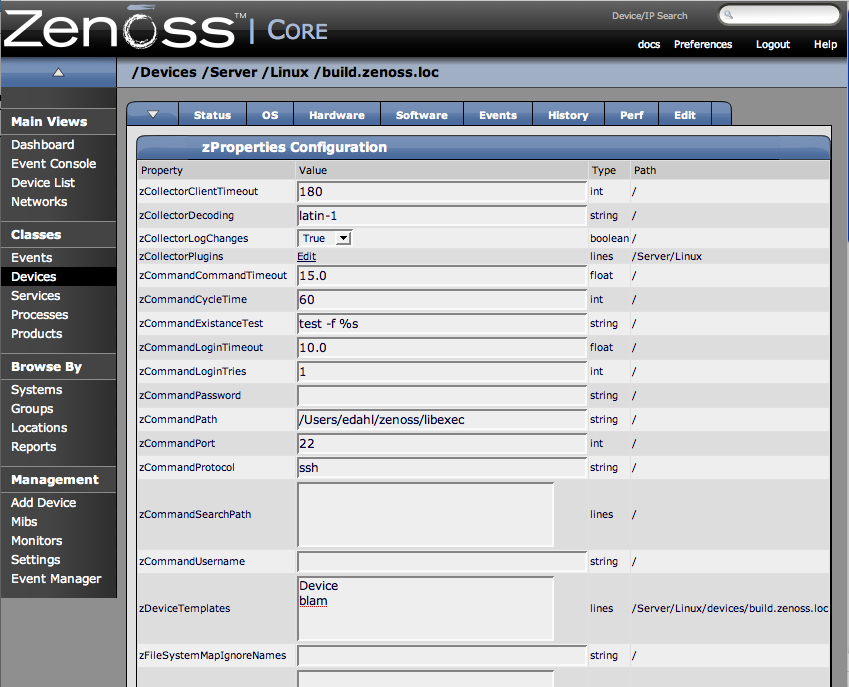
The Device zProperties tab is where you can configure zProperties either for all devices, for an individual device, or for any devices that fall further down in the device hierarchy tree. To configure them for all devices click the zProperties tab from the Device Overview tab. To configure zProperties for an individual device, click on the device name in the Device Overview and then click the zProperties tab for that device. To access the zProperties tab, open the device table menu, select More and then zProperties.
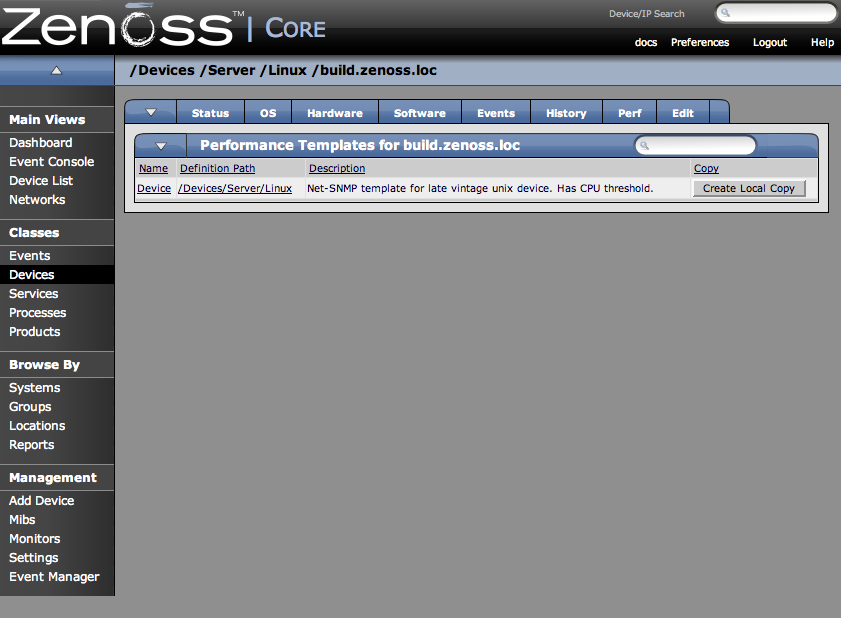
The template tab shows all of the performance templates bound by name to this device or group of devices. To access the Templates tab, open the Device table menu, select More and then Templates.
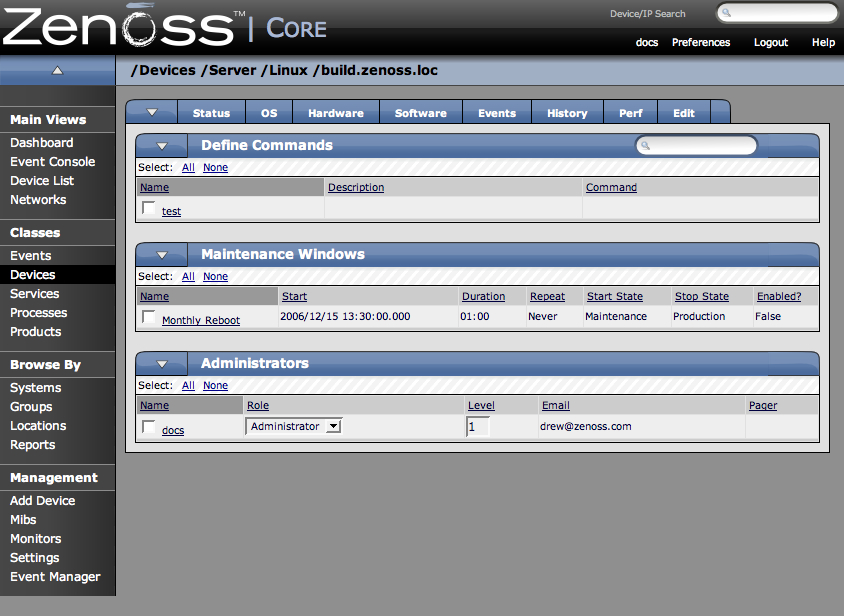
To access the Administration tab, open the Device page menu, select More and then Administration.
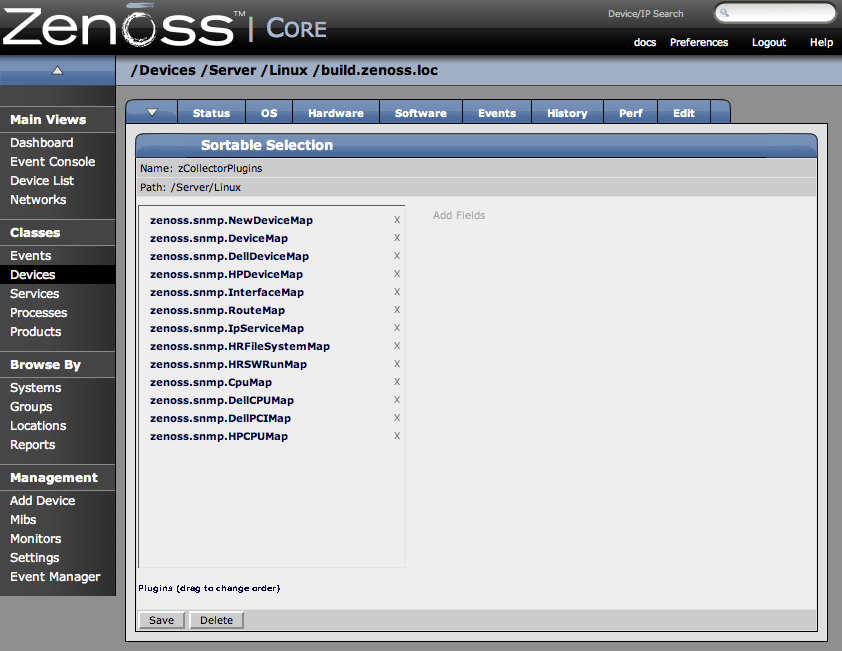
The Collector Plugins tab shows you a list of all plugins available for the device. To access the Collector Plugins tab, open the Device page menu, select More and then Collector Plugins.