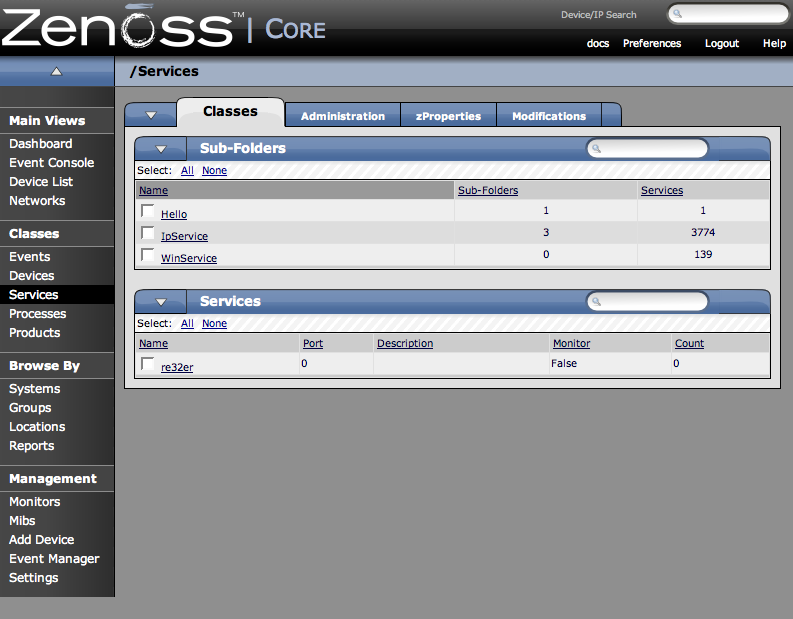
Use the Service menu to manage and monitor services that are running on your networks. To access the Services pages, from the left Navigational menu, choose Services. The Services Overview appears.
The Services overview shows the folders and sub-folders and lists all of the services that have been added to the system to monitor.
ZenStatus performs monitoring of TCP services. It is configured by turning on monitoring of a service under the “Services” root on the Navigation Toolbar. Service monitoring can be turned on a service class but this can be overridden on any service instance. For example, “SMTP” will be monitored by default but it may not be a critical service on all boxes. If this is the case, it may be removed on specific devices. Also, if the service is configured to only listen on localhost (127.0.0.1) the service will not be monitored.
To add a service to monitor:
-
From the Services Overview page, in the Services text field, enter the name of the service you want to monitor.
-
Click the Add button.
The service appears in the Services list.
-
To set monitoring to True, click the Edit tab and set the Monitor pop-up to True. The service is now being monitored.
To view the status information associated with a given service, select the service from the Services list in the Services Overview page.
The Individual Service Status tab appears.
This tab shows you a summary of the details associated with this service. You can see the name of the service, whether its monitored or not, a Description, any associated Service Keys and a List of Devices where the service is currently running. To change any of this information, click the Edit tab.
To edit the information that appears on the Individual Service Status tab, from the Individual Services page, click the Edit tab.
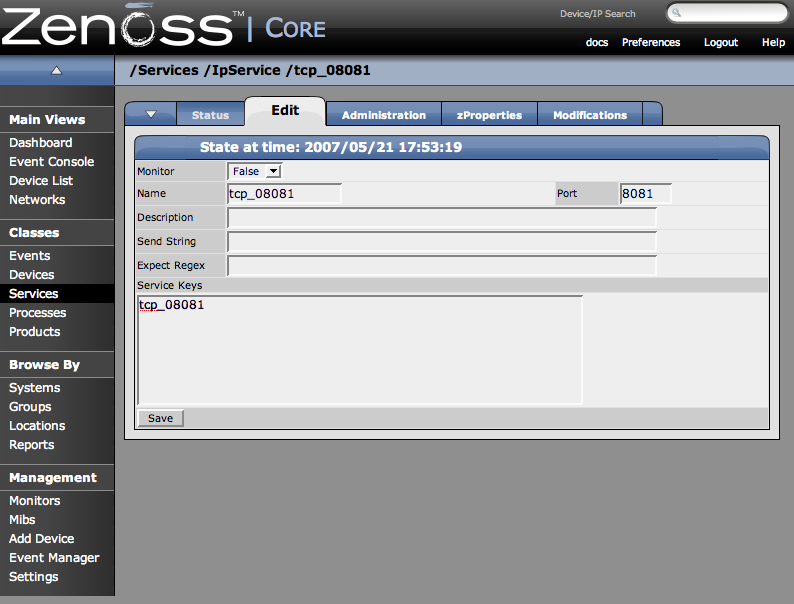
From this screen, use the Monitor pop-up to select True to monitor the service and False to not monitor the service. You can also add any associated Service Keys or enter a brief Description.
You can configure zProperties either for all services, for an individual service or for any services that fall further down in the service hierarchy tree. To configure them for all services click the zProperties tab from the Service Overview tab. To configure zProperties for an individual service, click on the service name in the Service Overview and then click the zProperties tab for that service. The Service zProperties Tab appears.
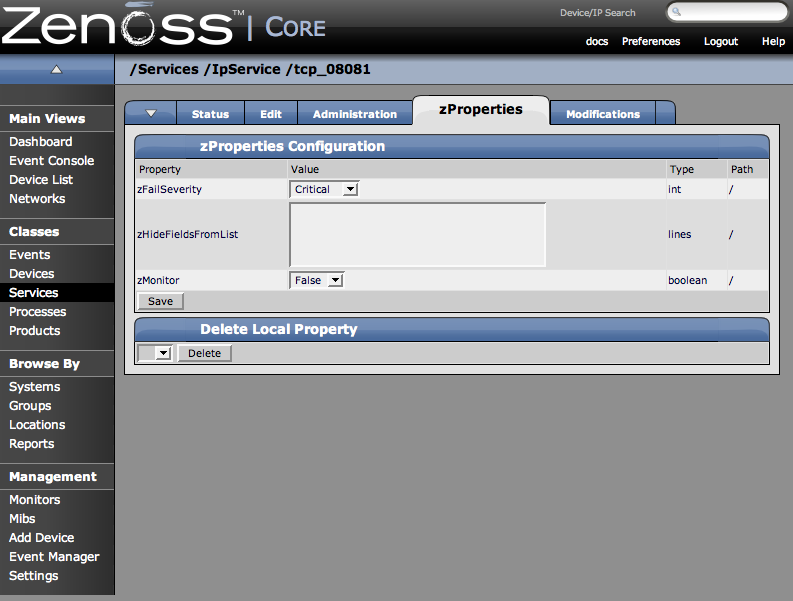
You can configure the following zProperties for an individual service from this tab:
-
ZFailSeverity
-
ZHideFieldsFromList
-
zMonitor
For more information about the Services zProperties, see the zProperties Appendix.
The /Server/Scan device class is an example configuration for monitoring TCP services on devices using a port scan. You can use this device class as a reference for your own configuration; or, if you have a device that you want to be monitored for service availability alone, you can place it under this device class. Zenoss will not collect performance data for devices in this class.
This section will show you how to set up monitoring of an IP service across a group of devices using a service class.
-
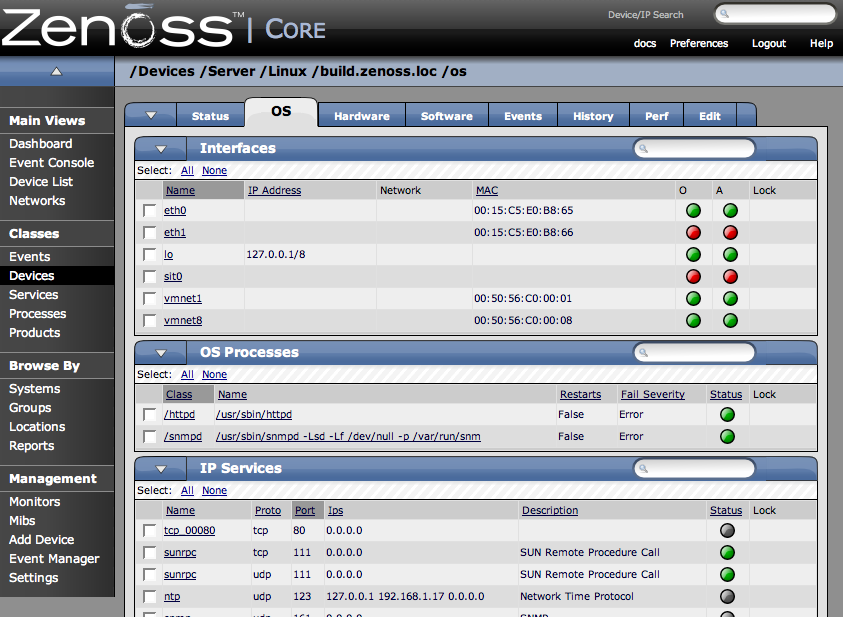
Navigate to the OS tab for a device you have loaded into the system.
The OS Tab for a device appears.
-
In the IP Services area, click the link to the service you want to monitor.
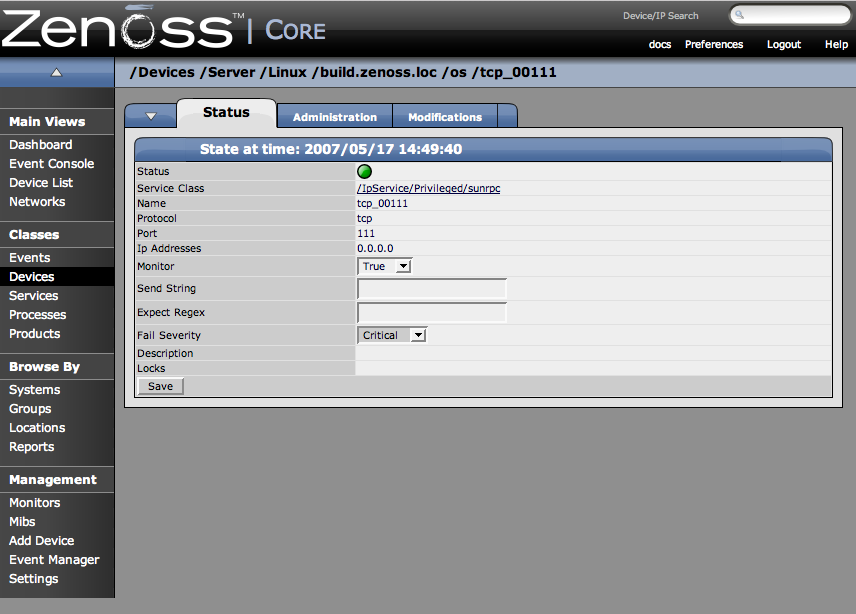
The service summary for the service you have selected appears.
-
From here set the Monitored flag to True to monitor this service for only this machine. You can also set this service to be monitored system-wide.
-
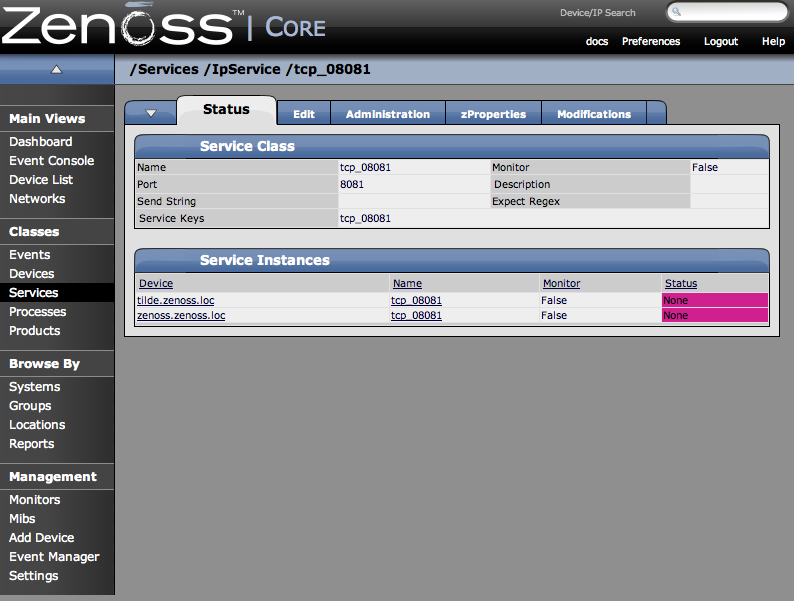
To monitor a service system wide, click the Click the Service Class link.
This page will show you everywhere the service is running and whether the service is monitored or not.
-
Click the Edit tab and set Monitored to True.
This will turn on monitoring for every instance of this service in the system.
-
Click Save.
-
Click the Status tab once again.
Most of the instances of the Service will now be set to green, meaning they are monitored and up. The ones that remain unmonitored indicate that they have this service class set to not monitor at a local level.