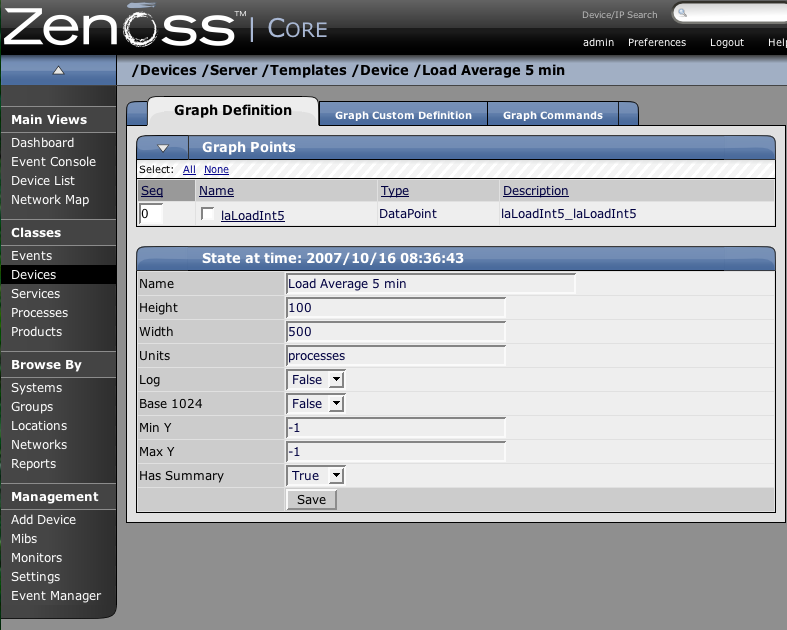
A Graph Definition contains the settings to produce a graphic representation of performance data on the device's Perf page or on the component's Status page. These graphs can include any of the Data Points or Thresholds from this Template. New Graph Definitions are created via the "Add Graph..." menu item on any Performance Template page. There are several settings on the Graph Definition that determine the appearance of the graph:
-
Name - The name of the graph as it will appear on the Perf or Status page.
-
Height - The height of the graph in pixels.
-
Width - The width of the graph in pixels
-
Units - The label for the graph's vertical axis.
-
Log - If True then the scale of the vertical axis will be logarithmic, if False then it is linear. This is useful in situations where the data being graphed grows exponentially. Note that only positive data can be graphed logarithmically.
-
Base 1024 - Select True if the data you are graphing is measured in multiples of 1000 or 1024.
-
Min Y - This sets the bottom value for the graph's vertical axis.
-
Max Y - This sets the top value for the graph's vertical axis.
-
Has Summary - If True then a summary of the data's current, average and maximum values is shown at the bottom of the graph.
Each Data Point or Threshold that is part of a graph is represented by a Graph Point. Several types of Graph Points are available that correspond to Data Points, Thresholds or Custom graphing commands. You can add as many Graph Points as you like to a Graph Definition. The Sequence field determines the order in which the Graph Points are drawn on the graph. You can edit the Sequence numbers and reorder the Graph Points using the Re-sequence Graph Points menu item. Note that Thresholds are always drawn before other Graph Points.
DataPoint Graph Points draw the value of Data Points from the Template on a graph. Add a new DataPoint Graph Point to the Graph Definiton using the "Add DataPoint..." menu item. The Add GraphPoint dialog will appear allowing you to select one or more Data Points defined in this Template. One DataPoint Graph Point will be created for each DataPoint you select in this list. Additionally, there is a Include related thresholds checkbox. If this is selected then any Graph Points will be created for any Thresholds that have been applied to the selected Data Points as well. Clicking on the name of a Graph Point will take you to its edit page. This page will have different fields for different types of Graph Points. DataPoint Graph Points have the following fields:
-
Name - This is the name that appears on the Graph Definition page and by default is also the name that will be used in the graph legend.
-
Consolidation - This is the RRD function used to graph the Data Point's data to the size of the graph. For most purposes the default value of AVERAGE is appropriate.
-
RPN - You may enter an RPN expression that alters the value of the data being graphed for the Data Point. For example, if the data is stored as bits but you would like to graph it as bytes you could use an RPN of "8,/" to divide by 8. You can read more details of RRDTool RPN notation at http://oss.oetiker.ch/rrdtool/tut/rpntutorial.en.html
-
Limit - You can specify a maximum value for the data being graphed.
-
Line Type - Select Line to have the data graphed as a line. Selecting Area will cause the area between the line and the horizontal axis to be filled with the same color as the line. You can select None if you want to use this Data Point for Custom RRD commands but don't want it to be explicitly drawn.
-
Line Width - Enter the pixel width of the line.
-
Stacked - If True then the Line or Area is drawn above the previously drawn data. At any point in time on the graph the value plotted for this data is the sum of the previously drawn data and the value of this Data Point at this time. For example, if you were measuring packets in and packets out you could stack them to get an idea of the total number of packets.
-
Color - You may specify a color for the Line or Area. Some color names are recognized but more reliably you can use a three or six digit hex value.
-
Format - This is the RRD format to use when displaying values in the graph summary. Information on RRDTool formatting strings can be found at http://oss.oetiker.ch/rrdtool/doc/rrdgraph_graph.en.html
-
Legend - This is the name that will be used for this data in the graph legend. By default this is a TALES expression that specifies the Graph Point name. The variables available in this TALES expression are here (the devicen or component being graphed) and graphPoint (the Graph Point itself.)
-
Available RRD Variables - This field lists the RRD variables already defined in this Graph Definition that could be used in the RPN field.
Threshold Graph Points draw the value of Thresholds from the Template on a graph. Add a new Threshold Graph Point to the Graph Definiton using the "Add Threshold..." menu item. The Add GraphPoint dialog will appear allowing you to select one or more Thresholds defined in this Template. One Threshold Graph Point will be created for each Threshold you select in this list. Threshold Graph Points have several settings: Name, Color and Legend. See the section on DataPoint Graph Points above for a description of these fields.
Custom Graph Points allow you to insert specific RRD graph commands into the Graph Definition. For details on DEF, CDEF and VDEF commands see http://oss.oetiker.ch/rrdtool/doc/rrdgraph_data.en.html. For details on the other RRD commands see http://oss.oetiker.ch/rrdtool/doc/rrdgraph_graph.en.html
The Graph Custom Definition tab allows you to specify exactly your own set of RRD commands to draw this graph. The Graph Points specified on the Graph Definition tab are used to define data that is available to the commands you specify here but the Graph Points will not be drawn unless you explicitly draw them with the commands you specify here. The Available RRD Variables lists the values defined by the Graph Points that are available for your use.