|
|
|
|
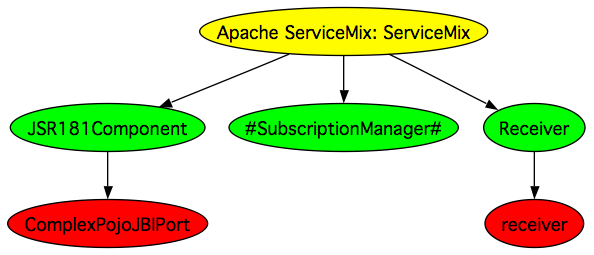
Inspired greatly by Gregor and Erik's great talk at TSSJS 2006 we've started to add some visualisation plugins into Apache ServiceMix. This implementation uses the Interfaces EndpointListener respectively ExchangeListener and creates DOT files (online viewer Grappa). Component and Endpoint visualisationThere is a <dotViewEndpointListener/> listener plugin which generates a DOT file representing the components and their endpoints.
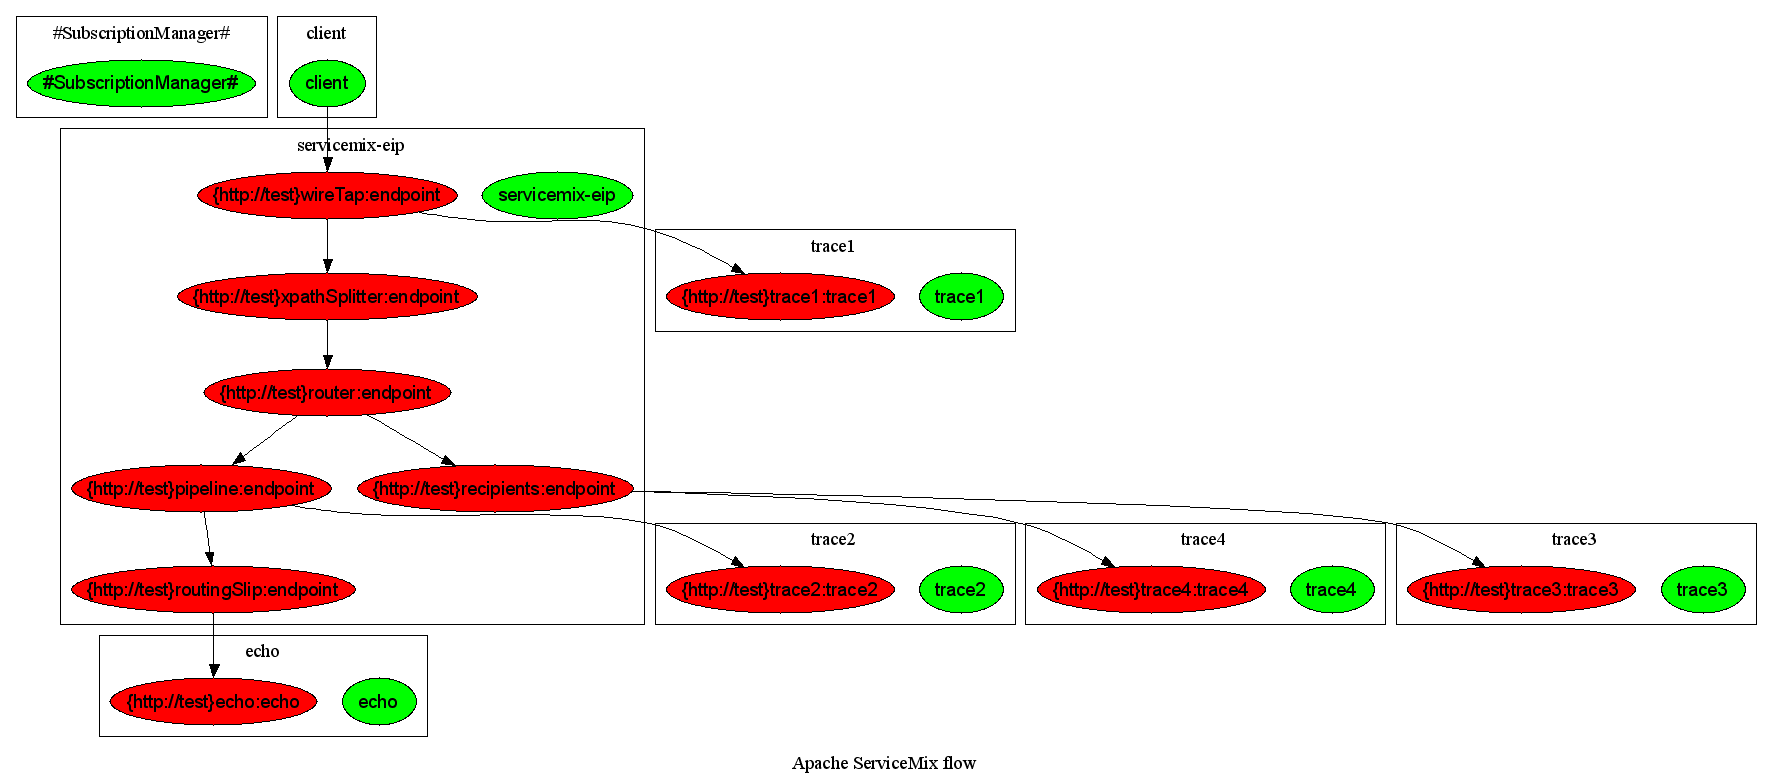
MessageExchange flow<dotViewFlowListener/> is another listener which generates a graph representing the message exchanges flow within the container.
ConfigurationThe following example shows how to configure a simple visualization listener in the servicemix.xml config file. Error formatting macro: snippet: java.lang.IndexOutOfBoundsException: Index: 20, Size: 20
Realtime MonitoringThe InstantSVC project provides a set of shell scripts which uses dnotify for monitoring the dot files generated by ServiceMix To achieve realtime monitoring postscript viewers can be used which usually have a feature to watch for file changes. A note for OS X usersIf you are using OS X then you can open the DOT file using graphviz which will then automatically re-render if it changes, so you end up with a real time graphical representation of the topic and queue hierarchies. Also if you want to edit the layout a little before adding it to a wiki to distribute to your team, open the DOT file with OmniGraffle then just edit away Visualisation Wish ListThere are so many different things we could visualise; our only limitation is our imagination. So if you have any ideas for what we could visualise please add something to our Visualisation Wish List |